Liquidity Rainbow - Trillion Research
Booster symbols help confirm short term trends and breakouts based off of two waveform functions, one long period, the other with a much shorter period. You get the buy signal that everyone else sees plus the confirmation!
This is a system that is not fully developed, PNL is not available yet. Strategy version is coming soon, still back testing.
I am tuning this model for crypto specifically, although it works for anything with a price chart.
2 EMAs (configurable to MA)
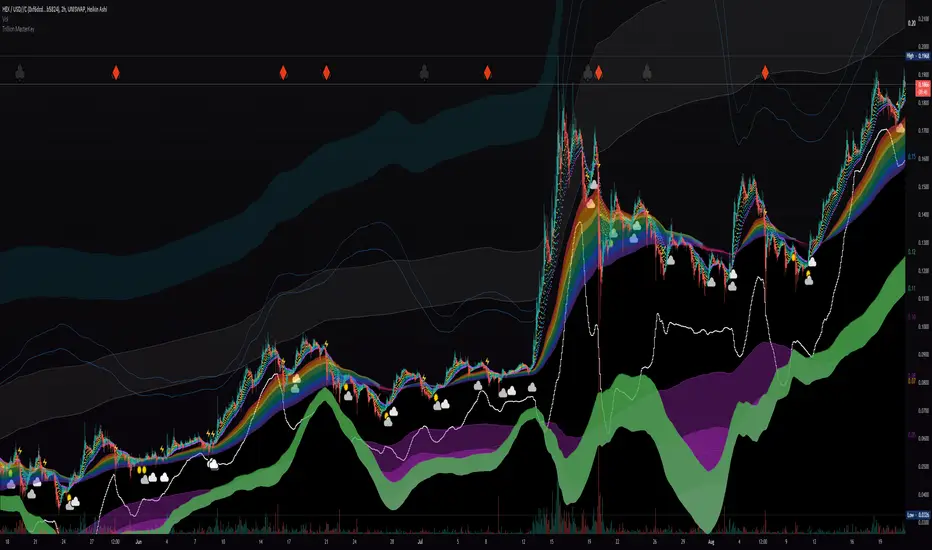
Dragonskin - RGB circle plots eMA
Rainbow - RGB area plots eMA
+When you see the rainbow appear it means that the price is above the slowest ema baseline. Generally bullish as price tends to ride the rainbow. Ideally, you will see a white cloud at the origin.
-When you see white step line cutting into the upper colors of the rainbow.
Once the price has traded below the rainbow for the FIRST time, not just wicked. You can set a target that's just above the previous high bodys above the rainbow. Do not sell the dip, let the floppers flop.
The second time price cuts down through a thick rainbow is usually bearish .
What makes me so sure? Liquidity
In order to be successful, we need to understand liquidity, the juiciest pockets of profit.
I will reveal more of the strategy in the second script.
For now, use:
SUN symbol - Notice how the price always seems to come back and sweep up any SUNs that get left behind (up and down) this is a liquidity nugget
CLOUD(s) indicators of support. Meaning that on ema trend we expect a lower price but each time that happens, it gets bought up above baseline. weak->strong (little gray - light blue - white)
LIGHTNING indicator of resistance. Meaning the price is not being allowed to recover, each time it rises above baseline, it is sold down again.
YELLOW CROSS - Classically known as a whale manipulation indicator. It tends to indicate a strong bearish move incoming or the reversal of an ongoing bearish move. There's dumping. "Get ready something is happening" indicator.
HEARTS = BUY
SPADES = Buy
CLUBS = Sell
DIAMONDS = SELL
*do not use these during periods of consolidation. consolidation is a period when the price swings in both directions but not too much. In a narrow range the indicators can pop up.
Why does this happen?
Short periods, during which exchanges stabilize the prices, are necessary for the redistribution of assets over the course of trading. Sometimes they happen multiple times a week and can last 24 or 48hours. Also it is a great time to eat up algo traders and that's why you'll see noise.
You want to focus on the period immediately following a consolidations. Don't rush it, they really do take 20 hours+
If you realize that you are in one of these consolidation ranges, limit order the tips of the wicks, nothing in the middle. There is not much profit here but also there is minimal risk.
If you're confirmed in a consolidation, exchanges will work to buoy the price to the appropriate mark price even if there is a big buy/sell order. A lot of time price will go up the congruent amount afterwards to compensate the toxic vwap .
I hope this helps people see the bigger picture and become even more successful with bigger gains.
I've tested this on all the major cryptos. Bitcoin BTC Ethereum ETH HEX
Honestly, I have tested very few stonks with this, later.
-Market Enemy
Skrip jemputan sahaja
Hanya pengguna disahkan oleh penulis boleh mengakses skrip ini. Anda perlu memohon dan mendapatkan kebenaran untuk menggunakannya. Keizinan selalunya diberikan selepas pembayaran. Untuk lebih butiran, ikuti arahan penulis di bawah atau hubungi LunaMoons secara terus.
TradingView TIDAK menyarankan pembayaran atau penggunaan skrip kecuali anda mempercayai sepenuhnya penulis dan memahami bagaimana ia berfungsi. Anda juga boleh menjumpai alternatif sumber terbuka dan percuma yang lain di dalam skrip komuniti kami.
Arahan penulis
Penafian
Skrip jemputan sahaja
Hanya pengguna disahkan oleh penulis boleh mengakses skrip ini. Anda perlu memohon dan mendapatkan kebenaran untuk menggunakannya. Keizinan selalunya diberikan selepas pembayaran. Untuk lebih butiran, ikuti arahan penulis di bawah atau hubungi LunaMoons secara terus.
TradingView TIDAK menyarankan pembayaran atau penggunaan skrip kecuali anda mempercayai sepenuhnya penulis dan memahami bagaimana ia berfungsi. Anda juga boleh menjumpai alternatif sumber terbuka dan percuma yang lain di dalam skrip komuniti kami.