OPEN-SOURCE SCRIPT
Telah dikemas kini Stochastic Overlay [NLR]
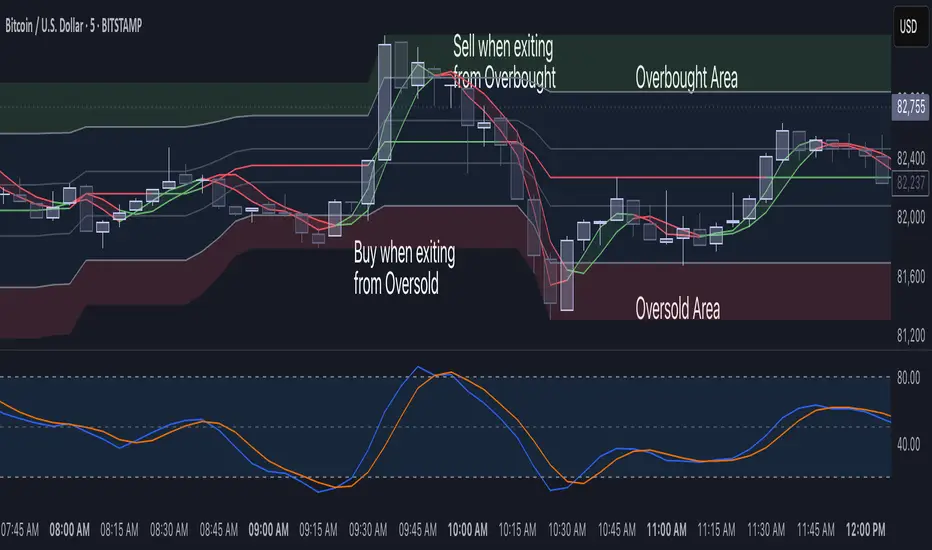
If you've ever traded with the Stochastic oscillator, you probably love its ability to gauge momentum and overbought/oversold conditions. However, one common frustration is interpreting its movements alongside the actual price chart. The oscillator, plotted separately, can feel disconnected from price action, forcing traders to constantly glance back and forth. That’s exactly the problem I wanted to solve with this indicator.
The Solution: Stochastic Overlay [NLR]
This indicator takes the familiar Stochastic oscillator and integrates it directly onto the price chart. Instead of struggling to correlate Stochastic signals with price movements, you now see the levels overlaid on the main chart, bringing momentum analysis into a more intuitive space.
What is the Stochastic Oscillator? (For the Newbies)
The Stochastic oscillator is a momentum-based indicator that measures the closing price relative to the high-low range over a specified period. It fluctuates between 0 and 100, helping traders identify potential reversals when the market is overbought (above 80) or oversold (below 20). The two key components are:
Technical Details of the Overlay
Why Do the %K & %D Lines Look “Crooked”?
Normally, the %K and %D lines range between 0 and 100, but in this overlay, they are scaled to fit the current price gap (the difference between the highest and lowest price in the selected period). This means their movement aligns more closely with price action, but it may appear distorted compared to a standard Stochastic oscillator.
For clarity, you can enable the visibility of %K and %D (Show %K %D option), allowing the scaled Stochastic values to be plotted within the price range.
Why Use This Overlay?
This tool transforms the way traders engage with Stochastic indicators, making momentum analysis more intuitive and efficient. Try it out, and see how your interpretation of price and momentum improves!
The Solution: Stochastic Overlay [NLR]
This indicator takes the familiar Stochastic oscillator and integrates it directly onto the price chart. Instead of struggling to correlate Stochastic signals with price movements, you now see the levels overlaid on the main chart, bringing momentum analysis into a more intuitive space.
What is the Stochastic Oscillator? (For the Newbies)
The Stochastic oscillator is a momentum-based indicator that measures the closing price relative to the high-low range over a specified period. It fluctuates between 0 and 100, helping traders identify potential reversals when the market is overbought (above 80) or oversold (below 20). The two key components are:
- %K (fast-moving line)
- %D (a smoothed moving average of %K)
Technical Details of the Overlay
- The indicator adjusts the traditional Stochastic calculation by multiplying the timeframe (HTF multiplier), allowing traders to view higher-timeframe Stochastics. Set HTF Multiplier to 1 to see current timeframe Stochastics
- It plots horizontal reference lines representing 0%, 20%, 40%, 50%, 60%, 80%, and 100% levels, giving a visual framework of price movement.
- Color-coded fills help differentiate bullish and bearish zones—making it easy to spot potential turning points.
Why Do the %K & %D Lines Look “Crooked”?
Normally, the %K and %D lines range between 0 and 100, but in this overlay, they are scaled to fit the current price gap (the difference between the highest and lowest price in the selected period). This means their movement aligns more closely with price action, but it may appear distorted compared to a standard Stochastic oscillator.
For clarity, you can enable the visibility of %K and %D (Show %K %D option), allowing the scaled Stochastic values to be plotted within the price range.
Why Use This Overlay?
- Better price interpretation: Instead of staring at a separate oscillator panel, you see momentum levels right where the price action unfolds.
- Higher-timeframe integration: Adjusting the multiplier allows you to track the Stochastic behavior of larger timeframes without switching charts.
- Clear visual cues: The colored fills and midpoint signals enhance readability for momentum shifts.
This tool transforms the way traders engage with Stochastic indicators, making momentum analysis more intuitive and efficient. Try it out, and see how your interpretation of price and momentum improves!
Nota Keluaran
- Added code comments
- Updated color scheme
For those not much familiar with Stochastic
The Stochastic indicator is designed to display the location of the close compared to the high/low range over a user defined number of periods. Typically, the Stochastic Oscillator is used for three things; Identifying overbought and oversold levels, spotting divergences and also identifying bull and bear set ups or signals.
I struggled with knowing exactly when the price was breaking out of the overbought and oversold levels, hitting 50%, or what %K and %D were really telling me.
So, I built a Stochastic overlay, making it easier to see how it all works in real time.
Think of Stochastic like road lanes for price movement. There are two key 20% lanes, one at the top and one at the bottom. When the price is inside these lanes, it tends to keep moving in that direction until it breaks out.
The center line is the average of the highest and lowest price in the given range, it’s a quick way to gauge where the price is trending overall.
The real money-making opportunities? Spotting when the price breaks out of a 20% band, signaling a potential reversal, or recognizing when it enters a 20% band and stays there, confirming strong momentum in that direction.
Instead of flipping between an oscillator panel and price action, this overlay lets you visually track momentum directly on the chart!
Ideally 15 min Stochastic works better from my experience for intraday trading.
Skrip sumber terbuka
Dalam semangat TradingView sebenar, pencipta skrip ini telah menjadikannya sumber terbuka, jadi pedagang boleh menilai dan mengesahkan kefungsiannya. Terima kasih kepada penulis! Walaupuan anda boleh menggunakan secara percuma, ingat bahawa penerbitan semula kod ini tertakluk kepada Peraturan Dalaman.
Penafian
Maklumat dan penerbitan adalah tidak bertujuan, dan tidak membentuk, nasihat atau cadangan kewangan, pelaburan, dagangan atau jenis lain yang diberikan atau disahkan oleh TradingView. Baca lebih dalam Terma Penggunaan.