PROTECTED SOURCE SCRIPT
ZLEMA Trend Index
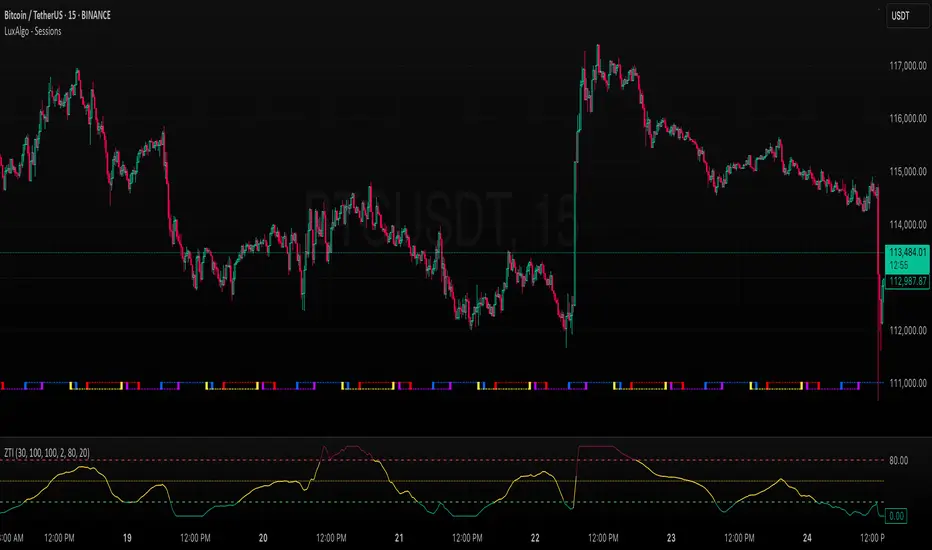
ZTI — ZLEMA Trend Index (0–100, 20/80 Bands)
Overview
ZTI is a trend-following oscillator built on the Zero‑Lag EMA (ZLEMA) and displayed in a consistent 0–100 pane. It’s designed to help prepare for participation in developing trends: readings below 20 highlight conditions to prepare for longs; readings above 80 highlight conditions to prepare for shorts. Color coding clarifies state at a glance: yellow inside the 20–80 band, maroon above 80, teal below 20.
How it works
Core: ZLEMA length 20 (configurable) reduces lag versus classic moving averages while maintaining smoothness.
Centering/scale: the ZLEMA line is recentered and scaled to fit a 0–100 view without distorting direction.
Bands: 80/20 act as trend preparation zones, not automatic reversal triggers.
Variables accessible in your scripts: overbought, oversold, zti, 0 - 100, center line is always 50
How to use it
Trend preparation:
Below 20 (teal): prepare to go long. Look for follow‑through back into the band (e.g., a hook up or a close returning above 20) before committing risk.
Above 80 (maroon): prepare to go short. Look for follow‑through back into the band (e.g., a hook down or a close returning below 80).
Example:
bullish_crossing_1 := ta.crossover(zti, overbought)
bullish_crossing_2 := ta.crossunder(zti, 70)
bullish_crossing_3 := ta.crossunder(zti, 60)
bullish_crossing_4 := ta.crossunder(zti, 50)
bearish_crossing_1 := ta.crossunder(zti, oversold)
bearish_crossing_2 := ta.crossover(zti, 30)
bearish_crossing_3 := ta.crossover(zti, 40)
bearish_crossing_4 := ta.crossover(zti, 50)
The zti line mirrors the flow of price action which is ideal if you need to follow trend snapshots between the overbough and oversold lines.
Continuation entries:
In uptrends, favor pullbacks where ZTI dips toward 20–40 and turns up again.
In downtrends, favor bounces where ZTI rises toward 60–80 and turns down again.
Exits and risk management:
Consider scaling out when maroon/teal fades back to yellow.
Use a return through the opposite band as a de‑risk or stop signal per system rules.
Multi‑timeframe workflow:
Define bias with a higher timeframe ZTI (e.g., H4/D1).
Execute on a lower timeframe only when it aligns with the higher timeframe’s 20/80 context.
Settings guidance:
ZLEMA length: 20 default. Lower (14–16) = faster, more sensitive; higher (24–30) = smoother, slower.
Center/scale windows: Larger = steadier amplitude; smaller = more responsive visualization.
Bands: 80/20 default. For very strong trenders, try 85/15; for choppier assets, 70/30.
Best practices
Treat 20/80 as preparation zones and require a confirm trigger (price structure, momentum cross, or a candle close back inside the band).
Avoid counter‑trend entries when the line is firmly maroon/teal; wait for a state change back into yellow with a confirming hook.
Combine with risk controls: predefined stop, trailing logic, and partial profit rules.
Limitations
As a moving‑average‑based tool, ZTI will still exhibit some lag and can compress/expand in extreme volatility. Tune length and windows to the instrument and timeframe.
Credits
ZLEMA techniques widely attributed to John Ehlers.
Disclaimer
This tool is for educational purposes only and is not financial advice. Backtest and forward‑test before live use, and always manage risk.
Skrip dilindungi
Skrip ini diterbitkan sebagai sumber tertutup. Akan tetapi, anda boleh menggunakannya dengan percuma dan tanpa had – ketahui lebih lanjut di sini.
Penafian
Maklumat dan penerbitan adalah tidak dimaksudkan untuk menjadi, dan tidak membentuk, nasihat untuk kewangan, pelaburan, perdagangan dan jenis-jenis lain atau cadangan yang dibekalkan atau disahkan oleh TradingView. Baca dengan lebih lanjut di Terma Penggunaan.