PROTECTED SOURCE SCRIPT
OBV Oscillator [CP]
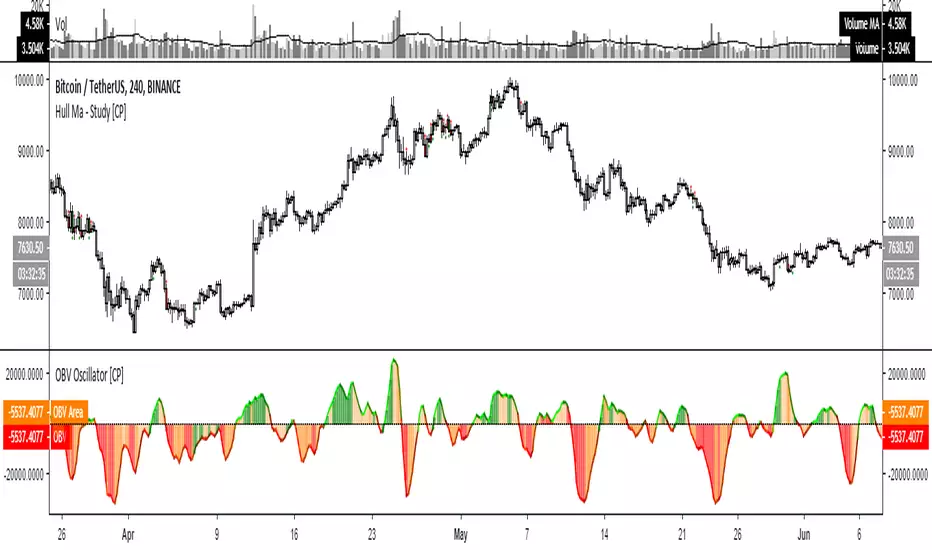
This is my version of the OBV Oscillator and I've used CCI to color the histogram
Line colors:
* Lime rising line above 0 line: Strong Bullish
* Green falling line above 0 line : Neutral Bullish
* Red falling line below 0 line : Strong Bearish
* Maroon rising line below 0 line : Neutral Bearish
Histogram colors:
*Green background above 0 line: Strong Bullish / Overbought
*Orange background above 0 line: Neutral Bullish
*Red background below 0 line: Strong Bearish / Oversold
*Orange background below 0 line: Neutral Bearish
Skrip dilindungi
Skrip ini diterbitkan sebagai sumber tertutup. Akan tetapi, anda boleh menggunakannya secara bebas dan tanpa apa-apa had – ketahui lebih di sini.
Penafian
Maklumat dan penerbitan adalah tidak bertujuan, dan tidak membentuk, nasihat atau cadangan kewangan, pelaburan, dagangan atau jenis lain yang diberikan atau disahkan oleh TradingView. Baca lebih dalam Terma Penggunaan.