PROTECTED SOURCE SCRIPT
Telah dikemas kini TraderLion's Relative Strength Line
Relative Strength Line
Introduction
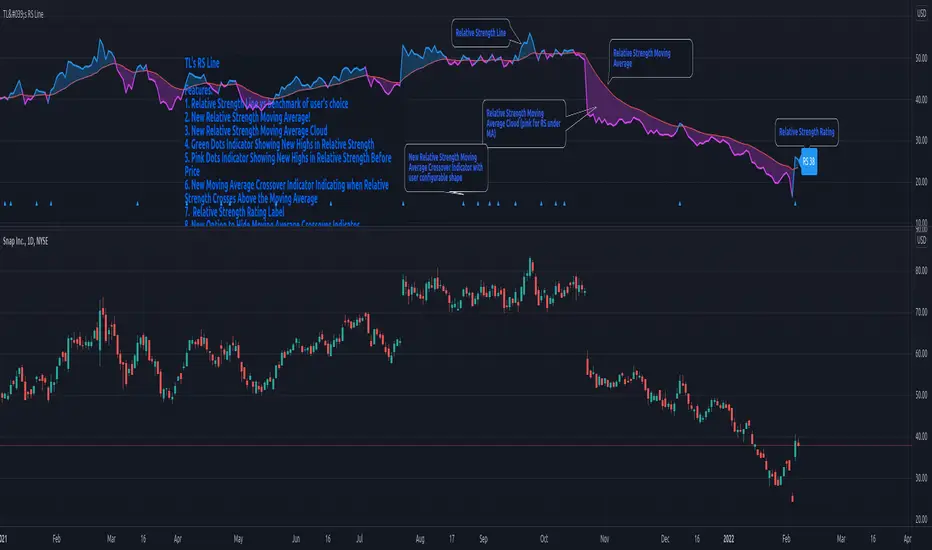
The script adds a line/candlestick to your charts that shows how well a stock is acting relative to the Index. We call this Relative Strength Line.
Relative Strength ( RS ) separates leading stocks from laggards. Stocks showing RS during a market correction phase will often be the strongest movers once the general market is ready to cooperate.
Instructions on How To Add this Script to Your TradingView Charting Platform
Step 0: Head over to tradingview.com/u/TraderLion/
Step 1: Add “TraderLion's Relative Strength Line” to your Favorites by clicking “Add to Favorite Scripts” near the bottom of the page.
Step 2: Click “Indicators” at the very top on TradingView. Under Favorites click “Relative Strength Line”
Step 3: Hover on the Indicator name ( Relative Strength Line) on your plot under legend and click the three dots at the very right. Under the “Pin To Scale” choose a setting that works best for you (optional).
Step 4: Done. You have now plotted the Relative Strength Line
Features
1) The Pink Dot symbolizes the RS Line reaching new highs before price. RS New Highs Before Price (RSNHBP) is often indicative of a break out emerging.
2) Direction-Based Relative Strength. The RS Line can be customized to color coat depending on its most recent direction. When the line moves up it will be blue, and on the way down pink. Easily glance and see phases of relative strength on the chart.
3) Raw RS Rating - The RS Line Script features an RS Rating from 1-99 with 99 being the strongest rating. The measures the stock’s performance relative to the Index you input.
3) Custom Index Input under Settings - requested feature!
4) Candlestick Relative Strength - A different unique way to view the Relative Strength Line
5) Alerts Conditions - Relative Strength New Highs and Relative Strength New Highs Before Price (RSNHBP)
Introduction
The script adds a line/candlestick to your charts that shows how well a stock is acting relative to the Index. We call this Relative Strength Line.
Relative Strength ( RS ) separates leading stocks from laggards. Stocks showing RS during a market correction phase will often be the strongest movers once the general market is ready to cooperate.
Instructions on How To Add this Script to Your TradingView Charting Platform
Step 0: Head over to tradingview.com/u/TraderLion/
Step 1: Add “TraderLion's Relative Strength Line” to your Favorites by clicking “Add to Favorite Scripts” near the bottom of the page.
Step 2: Click “Indicators” at the very top on TradingView. Under Favorites click “Relative Strength Line”
Step 3: Hover on the Indicator name ( Relative Strength Line) on your plot under legend and click the three dots at the very right. Under the “Pin To Scale” choose a setting that works best for you (optional).
Step 4: Done. You have now plotted the Relative Strength Line
Features
1) The Pink Dot symbolizes the RS Line reaching new highs before price. RS New Highs Before Price (RSNHBP) is often indicative of a break out emerging.
2) Direction-Based Relative Strength. The RS Line can be customized to color coat depending on its most recent direction. When the line moves up it will be blue, and on the way down pink. Easily glance and see phases of relative strength on the chart.
3) Raw RS Rating - The RS Line Script features an RS Rating from 1-99 with 99 being the strongest rating. The measures the stock’s performance relative to the Index you input.
3) Custom Index Input under Settings - requested feature!
4) Candlestick Relative Strength - A different unique way to view the Relative Strength Line
5) Alerts Conditions - Relative Strength New Highs and Relative Strength New Highs Before Price (RSNHBP)
Nota Keluaran
Added ability to move the RS Line to a different pane.Nota Keluaran
Reduced Precision from 16 decimal places to 2 decimal places.Nota Keluaran
Remove Relative Strength Rating as it's causing confusion among many traders.Nota Keluaran
Per many user requests, we added back the RS Rating ability. The default is set to False you can toggle it to true in the Input Settings of this indicator.Cheers,
-Team TL
Nota Keluaran
1. Updated chart to meet Pine Script House Rules2. Changed Short Title to TL's RS Line
Nota Keluaran
Updates:1. Added the relative strength moving average (user configurable).
2. Added the relative strength moving average cloud (appearance user configurable).
3. Added the triangle up indicator at the bottom of the chart to signal when the RS line overtakes the moving average.
Nota Keluaran
Fixed typo in codeNota Keluaran
1. Added offset parameter to allow user to adjust vertical positioning of relative strength indicator on their charts. Please note that to successfully use this adjustment the indicator should be pinned to the same scale as the price. 2. New option to hide Relative Strength Moving Average Crossover Indicator.
Skrip dilindungi
Skrip ini diterbitkan sebagai sumber tertutup. Akan tetapi, anda boleh menggunakannya secara bebas dan tanpa apa-apa had – ketahui lebih di sini.
Penafian
Maklumat dan penerbitan adalah tidak bertujuan, dan tidak membentuk, nasihat atau cadangan kewangan, pelaburan, dagangan atau jenis lain yang diberikan atau disahkan oleh TradingView. Baca lebih dalam Terma Penggunaan.