OPEN-SOURCE SCRIPT
Telah dikemas kini CT Reverse MACD Cross
Introducing the Reverse MACD Cross
MACD.... short for moving average convergence/divergence, is a trading indicator used in technical analysis of stock prices, created by Gerald Appel in the late 1970s.
It is designed to reveal changes in the strength, direction, momentum, and duration of a trend in a stock's price.
Prior work by Johny Dough showed how we can compute the price level required to make the MACD stay at its current level,
and also how to compute the price level required for the MACD to cross the zero line.
I have brought that idea to it logical conclusion for the MACD by creating a new function which also computes the price level required to cross the MACD with its signal line.
This allows the user to quickly see all of the most relevant information from the MACD and the actual price levels where the indicator will change its posture.
The MACD indicator (or "oscillator") is a collection of three time series calculated from historical price data, most often the closing price.
These three series are:
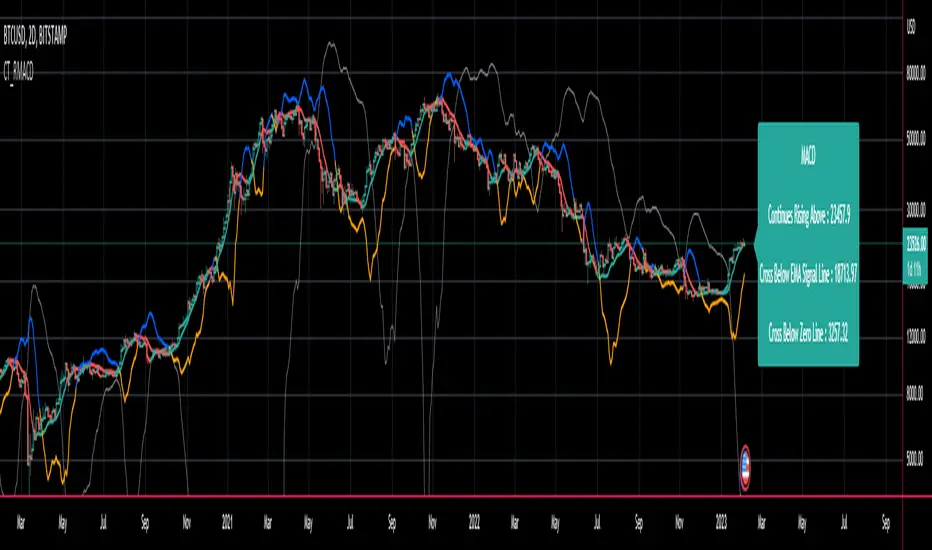
- the MACD series proper shown here in blue
- the "Signal Line" or "average" series shown here in red
- the "Divergence" series which is the difference between the two shown here as a histogram.
There is also usually a baseline set at zero.
The MACD series is the difference between a "fast" (short period) exponential moving average (EMA), and a "slow" (longer period) EMA of the price series.
The average series (signal line) is an EMA of the MACD series itself.
The MACD indicator thus depends on three parameters, namely the time periods of the three EMAs.
The notation "MACD ( a, b, c )" usually denotes the standard indicator where the MACD series is the difference of EMAs with characteristic times a and b, and the average series is an EMA of the MACD series with characteristic time c.
There is an infobox which displays...- Whether the MACD is falling or rising
- the price level which will make the MACD to change from rising to falling or vice versa
- the price level which will cause the MACD to cross the signal line
- the price level which will cause the MACD to cross the zero line
The most commonly used values are 12 for the fast, 26 for the slow, and 9 for the signal line, that is, MACD ( 12, 26, 9 ).
The MACD and average series are customarily displayed as continuous lines in a plot whose horizontal axis is time oscillating above and below a zero line, whereas the divergence is commonly shown as a bar graph / histogram.
A fast EMA responds more quickly than a slow EMA to recent changes in a stock's price.
By comparing EMAs of different periods, the MACD series can indicate changes in the trend of a stock.
It is claimed that the divergence series can reveal subtle shifts in the stock's trend.
Since the MACD is based on moving averages, it is a lagging indicator. As a future metric of price trends, the MACD is less useful for stocks that are not trending (trading in a range) or are trading with unpredictable price action.- Whether the MACD is falling or rising
Nota Keluaran
Corrected code description and minor function errorNota Keluaran
Switched plot order to bring lines to the front of the histogramNota Keluaran
Created and added SMA signal line cross function by request.. Added
- optional SMA signal line
- optional SMA based histogram
Modified textbox info and coloring logic for clarity
Nota Keluaran
Final tidy upNota Keluaran
Added Zeroline cutoff feature to the reverse functions in order to alleviate autofocus chart issues.Removed transp variable from plot functions in advance of its planned obsolescence.
Nota Keluaran
Upgraded to Pinescript Version 5Added plot settings options.
Added settings headings.
Skrip sumber terbuka
Dalam semangat TradingView sebenar, pencipta skrip ini telah menjadikannya sumber terbuka, jadi pedagang boleh menilai dan mengesahkan kefungsiannya. Terima kasih kepada penulis! Walaupuan anda boleh menggunakan secara percuma, ingat bahawa penerbitan semula kod ini tertakluk kepada Peraturan Dalaman.
You may contact me on Krown's Crypto Cave Discord: discord.gg/W9ettX54DF My Discord username is The Caretaker.
My Private indicators are available via :
krown-trading.teachable.com/?affcode=236462_mm1lb1_w
My Private indicators are available via :
krown-trading.teachable.com/?affcode=236462_mm1lb1_w
Penafian
Maklumat dan penerbitan adalah tidak bertujuan, dan tidak membentuk, nasihat atau cadangan kewangan, pelaburan, dagangan atau jenis lain yang diberikan atau disahkan oleh TradingView. Baca lebih dalam Terma Penggunaan.