forexpirate

Pairs SMA Cross Over/Under

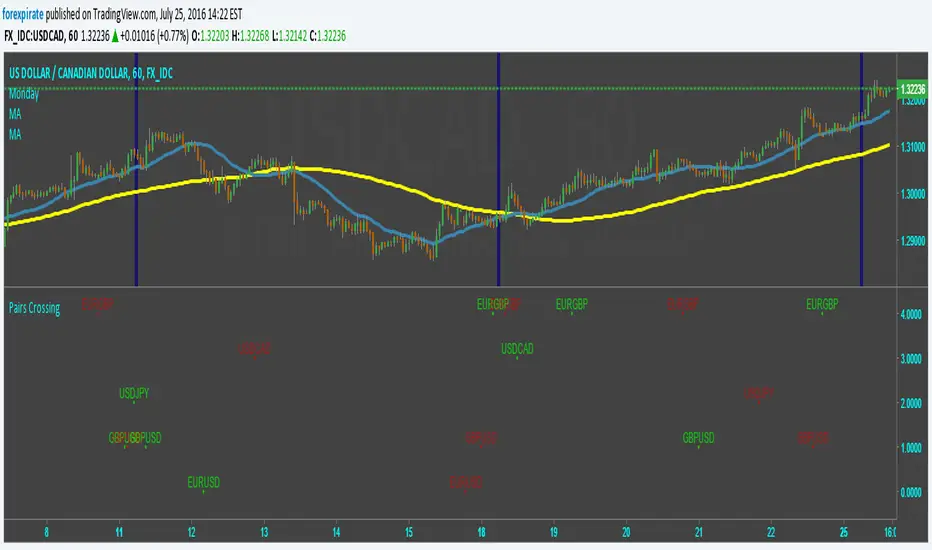
Indicator shows when a pair's SMAs cross-above or cross-under. You pick the pairs by changing the s#-corresponding to the p# matching the pair you want. The other variable numbers are out of order but it doesn't matter expect to the look of the script.
Skrip sumber terbuka

Dalam semangat TradingView yang sebenar, penulis skrip ini telah menerbitkannya dengan menggunakan sumber terbuka supaya pedagang-pedagang dapat memahami dan mengesahkannya. Sorakan kepada penulis! Anda dapat menggunakannya secara percuma tetapi penggunaan semula kod ini dalam penerbitan adalah dikawalselia oleh Peraturan Dalaman. Anda boleh menyukainya untuk menggunakannya pada carta.

Penafian

Maklumat dan penerbitan adalah tidak dimaksudkan untuk menjadi, dan tidak membentuk, nasihat untuk kewangan, pelaburan, perdagangan dan jenis-jenis lain atau cadangan yang dibekalkan atau disahkan oleh TradingView. Baca dengan lebih lanjut di Terma Penggunaan.

Ingin menggunakan skrip ini pada carta?
//@version=2
study("Pairs Crossing")
f = input(title="Fast",defval=21)
s = input(title="Slow", defval=89)
p0 = input(title="Other data series", type=symbol,defval="FX_IDC:audjpy")
p1 = input(title="Other data series", type=symbol,defval="FX_IDC:audnzd")
p2 = input(title="Other data series", type=symbol,defval="FX_IDC:audusd")
p3 = input(title="Other data series", type=symbol,defval="FX_IDC:cadjpy")
p17 = input(title="Other data series", type=symbol,defval="FX_IDC:euraud")
p4 = input(title="Other data series", type=symbol,defval="FX_IDC:eurcad")
p5 = input(title="Other data series", type=symbol,defval="FX_IDC:eurgbp") 
p6 = input(title="Other data series", type=symbol,defval="FX_IDC:eurjpy")
p7 = input(title="Other data series", type=symbol,defval="FX_IDC:eurnzd")
p8 = input(title="Other data series", type=symbol,defval="FX_IDC:eurusd")
p9 = input(title="Other data series", type=symbol,defval="FX_IDC:gbpaud")
p10 = input(title="Other data series", type=symbol,defval="FX_IDC:gbpjpy")
p11 = input(title="Other data series", type=symbol,defval="FX_IDC:gbpnzd")
p12 = input(title="Other data series", type=symbol,defval="FX_IDC:gbpusd")
p13 = input(title="Other data series", type=symbol,defval="FX_IDC:nzdjpy")
p14 = input(title="Other data series", type=symbol,defval="FX_IDC:nzdusd")
p15 = input(title="Other data series", type=symbol,defval="FX_IDC:usdcad")
p16 = input(title="Other data series", type=symbol,defval="FX_IDC:usdjpy")
s0= security(p0, period, close)
s1= security(p1, period, close)
s2= security(p2, period, close)
s3= security(p3, period, close)
s4= security(p4, period, close)
s5= security(p5, period, close)
s6= security(p6, period, close)
s7= security(p7, period, close)
s8= security(p8, period, close)
s9= security(p9, period, close)
s10= security(p10, period, close)
s11= security(p11, period, close)
s12= security(p12, period, close)
s13= security(p13, period, close)
s14= security(p14, period, close)
s15= security(p15, period, close)
s16= security(p16, period, close)
s17= security(p17, period, close)

co11 = iff(crossover(sma(s8,f),sma(s8,s)),0,na)
plotshape(co11,location=location.absolute,text="EURUSD",color=lime)
co10 = iff(crossover(sma(s12,f),sma(s12,s)),1,na)
plotshape(co10,location=location.absolute,text="GBPUSD",color=lime)
co12 = iff(crossover(sma(s16,f),sma(s16,s)),2,na)
plotshape(co12,location=location.absolute,text="USDJPY",color=lime)
co14 = iff(crossover(sma(s15,f),sma(s15,s)),3,na)
plotshape(co14,location=location.absolute,text="USDCAD",color=lime)
co5 = iff(crossover(sma(s5,f),sma(s5,s)),4,na)
plotshape(co5,location=location.absolute,text="EURGBP",color=lime)
//co9 = iff(crossover(sma(s9,f),sma(s9,s)),5,na)
//plotshape(co9,location=location.absolute,text="GBPAUD",color=lime)
//co7 = iff(crossover(sma(s7,f),sma(s7,s)),6,na)
//plotshape(co7,location=location.absolute,text="EURNZD",color=lime)
//co6 = iff(crossover(sma(s6,f),sma(s6,s)),7,na)
//plotshape(co6,location=location.absolute,text="EURJPY",color=lime)

cu11 = iff(crossunder(sma(s8,f),sma(s8,s)),0,na)
plotshape(cu11,location=location.absolute,text="EURUSD",color=red)
cu10 = iff(crossunder(sma(s12,f),sma(s12,s)),1,na)
plotshape(cu10,location=location.absolute,text="GBPUSD",color=red)
cu12 = iff(crossunder(sma(s16,f),sma(s16,s)),2,na)
plotshape(cu12,location=location.absolute,text="USDJPY",color=red)
cu14 = iff(crossunder(sma(s15,f),sma(s15,s)),3,na)
plotshape(cu14,location=location.absolute,text="USDCAD",color=red)
cu5 = iff(crossunder(sma(s5,f),sma(s5,s)),4,na)
plotshape(cu5,location=location.absolute,text="EURGBP",color=red)
//cu9 = iff(crossunder(sma(s9,f),sma(s9,s)),5,na)
//plotshape(cu9,location=location.absolute,text="GBPAUD",color=red)
//cu7 = iff(crossunder(sma(s7,f),sma(s7,s)),6,na)
//plotshape(cu7,location=location.absolute,text="EURNZD",color=red)
//cu6 = iff(crossunder(sma(s6,f),sma(s6,s)),7,na)
//plotshape(cu6,location=location.absolute,text="EURJPY",color=red)