OPEN-SOURCE SCRIPT
Currency Conversion Chart
Releasing this utility indicator I made for myself and thought others may find it helpful.
It is a simple currency conversion indicator. I personally trade both the TSX and the NYSE and hold both CAD and USD. As such, when I take positions in either or, I like to track how the currency I hold is affecting my position.
What the indicator does:
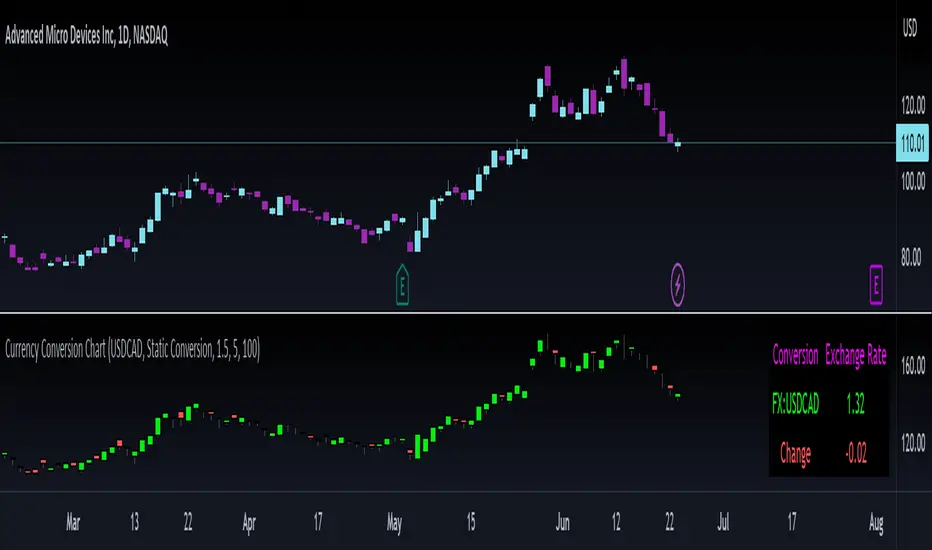
So, as indicated above, it converts a ticker's candlestick chart into the designated currency. You can either manually set the currency exchange rate, or search the currency exchange chart on Tradingview and it will auto-convert:

Purple arrow: The purple arrow points to the auto-input. You can search the currency you want to convert and it will automatically apply the conversion. It defaults to USD to CAD, but you can do USD to JPY, AUD to CAD, whatever currency you want provided it is available on tradingview. Alternatively, you can select manual conversion and input the manual conversion rate to apply.
Green Arrow: The green arrow refers to the conversion type. The indicator will default to static auto. This will pull the previous daily close. As currency trades at all hours, real-time is not advisable because the currency is in constant flux. Static will provide more stable results. However, you can toggle between the two. You can also just toggle Manual conversion.

Yellow arrow and red arrow: These pertain to position management. The indicator will display the change in the currency price over the designated amount of days. If you want to know how much the currency has changed in price over the last 7 or 20 days, simply put that value in the change input.
When you click manage position, you can fill out the position size variable and put the number of days you have had the position in the change parameter. This is the cost of your position. It can be options or shares. It will then adjust your position cost for the current change in the currency based on the number of days you have held it.
The indicator can be viewed on any timeframe and you can see how the conversion price compares to the listed price.
And that's basically the indicator! Its a simple utility indicator and hopefully some people will find use from it like I do!
Safe trades everyone, take care.
It is a simple currency conversion indicator. I personally trade both the TSX and the NYSE and hold both CAD and USD. As such, when I take positions in either or, I like to track how the currency I hold is affecting my position.
What the indicator does:
So, as indicated above, it converts a ticker's candlestick chart into the designated currency. You can either manually set the currency exchange rate, or search the currency exchange chart on Tradingview and it will auto-convert:
Purple arrow: The purple arrow points to the auto-input. You can search the currency you want to convert and it will automatically apply the conversion. It defaults to USD to CAD, but you can do USD to JPY, AUD to CAD, whatever currency you want provided it is available on tradingview. Alternatively, you can select manual conversion and input the manual conversion rate to apply.
Green Arrow: The green arrow refers to the conversion type. The indicator will default to static auto. This will pull the previous daily close. As currency trades at all hours, real-time is not advisable because the currency is in constant flux. Static will provide more stable results. However, you can toggle between the two. You can also just toggle Manual conversion.
Yellow arrow and red arrow: These pertain to position management. The indicator will display the change in the currency price over the designated amount of days. If you want to know how much the currency has changed in price over the last 7 or 20 days, simply put that value in the change input.
When you click manage position, you can fill out the position size variable and put the number of days you have had the position in the change parameter. This is the cost of your position. It can be options or shares. It will then adjust your position cost for the current change in the currency based on the number of days you have held it.
The indicator can be viewed on any timeframe and you can see how the conversion price compares to the listed price.
And that's basically the indicator! Its a simple utility indicator and hopefully some people will find use from it like I do!
Safe trades everyone, take care.
Skrip sumber terbuka
Dalam semangat sebenar TradingView, pencipta skrip ini telah menjadikannya sumber terbuka supaya pedagang dapat menilai dan mengesahkan kefungsiannya. Terima kasih kepada penulis! Walaupun anda boleh menggunakannya secara percuma, ingat bahawa menerbitkan semula kod ini adalah tertakluk kepada Peraturan Dalaman kami.
Easter sale starts April 18th for 50% off!
Get:
- Live Updates,
- Discord access,
- Access to my Proprietary Merlin Software,
- Access to premium indicators,
patreon.com/steversteves
Get:
- Live Updates,
- Discord access,
- Access to my Proprietary Merlin Software,
- Access to premium indicators,
patreon.com/steversteves
Penafian
Maklumat dan penerbitan adalah tidak dimaksudkan untuk menjadi, dan tidak membentuk, nasihat untuk kewangan, pelaburan, perdagangan dan jenis-jenis lain atau cadangan yang dibekalkan atau disahkan oleh TradingView. Baca dengan lebih lanjut di Terma Penggunaan.