OPEN-SOURCE SCRIPT
Telah dikemas kini Volatility Meter
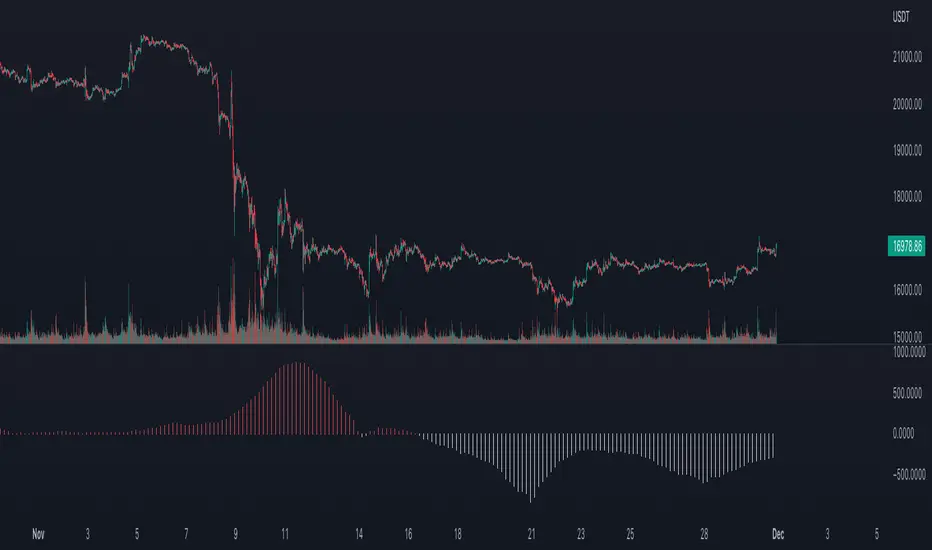
The title is quite self explanatory. It is a Volatility Meter based on Bollinger Bands Width and MA.
These parameters can be selected by users in settings tab:
- Basic Bollinger Bands Parameters: length, standart deviation and source
- Timeframes: 1h, 2h, 3h and 4h
If the indicator is red it means volatility is high in the market. If it is white, it means that market is not volatile right now.
These parameters can be selected by users in settings tab:
- Basic Bollinger Bands Parameters: length, standart deviation and source
- Timeframes: 1h, 2h, 3h and 4h
If the indicator is red it means volatility is high in the market. If it is white, it means that market is not volatile right now.
Nota Keluaran
The title is self-explanatory. It is a Volatility Meter based on Bollinger Bands Width and Moving Averages. It also uses the concept of multi-time frame analysis.You can decide the options below on the settings tab:
- Basic Bollinger Bands Parameters: length, standart deviation and source
- Timeframes: 1h, 2h, 3h and 4h
If the indicator is red, it means volatility is high in the market. If it is white, it means the market is not volatile right now. If you use it in a smaller timeframe than it is calculated then you will get the multi-timeframe analysis of the volatility. As could be seen on the chart above, if it is red it usually means that big market moves are expected.
Use it on 4H or smaller time frames to get the multi-time frame volatility insight. If you use it on the time frame greater than 4H please select the calculated time frame accordingly. (NOTE: credits on the source code is removed.)
Skrip sumber terbuka
Dalam semangat TradingView sebenar, pencipta skrip ini telah menjadikannya sumber terbuka, jadi pedagang boleh menilai dan mengesahkan kefungsiannya. Terima kasih kepada penulis! Walaupuan anda boleh menggunakan secara percuma, ingat bahawa penerbitan semula kod ini tertakluk kepada Peraturan Dalaman.
Penafian
Maklumat dan penerbitan adalah tidak bertujuan, dan tidak membentuk, nasihat atau cadangan kewangan, pelaburan, dagangan atau jenis lain yang diberikan atau disahkan oleh TradingView. Baca lebih dalam Terma Penggunaan.