OPEN-SOURCE SCRIPT
Telah dikemas kini [blackcat] L1 Mel Widner Rainbow Oscillator
NOTE: Because the originally released script failed to comply with the House Rule in the description, it was banned. After revising and reviewing the description, it is republished again. Please forgive the inconvenience caused.
Level: 1
Background
Mel Widner developed the Rainbow Oscillator and published it in 1997 in the Technical Analysis of Stocks and Commodities magazine.
Function
Mel Widner Rainbow Oscillator helps to predict the changes in the market trend and to follow trends. The oscillator is derived from a consensus of trends that, when plotted in color, has the appearance of a rainbow. It offers only two possible states, the upward and the downward. The Rainbow Oscillator is based on the Rainbow charts trend and is just like the Rainbow Moving Average charts. It works on the basis of a two-period moving average and its graph also helps to identify the highest high value and the lowest low value among moving averages. The Rainbow Oscillator is a simple indicator used to forecast trend reversal. It is a simple yet very important technical analysis tool. The oscillator works on the same rules as does the Rainbow indicator. It uses two simple moving averages, HHV and LLV. The Rainbow Oscillator creates an oscillator with bandwidth lines. Although it is a relatively new indicator but has become very popular for effectively forecasting the changes in the trend direction. The Rainbow Oscillator appears as a director of the trend as it follows the ups and downs of the market. The growing width of the Rainbow indicates that the current trend is likely to continue. The values of the Rainbow Oscillator beyond 80 suggest an unstable market and prone to a sudden reversal of the current market trend. On the other hand, when the prices move to the Rainbow and the Rainbow Oscillator begins to become flat, it indicates that the market is stable and the bandwidth decreases. The Rainbow Oscillator values falling below 20 again indicate an unstable market and also prone to a sudden reversal of the current trend in the market.
In simple words, we can derive the following rules.
Key Signal
PosNeg --> Rainbow Oscillator Output.
Labels and alerts are added.
Remarks
This is a Level 1 free and open source indicator.
Feedbacks are appreciated.
Level: 1
Background
Mel Widner developed the Rainbow Oscillator and published it in 1997 in the Technical Analysis of Stocks and Commodities magazine.
Function
Mel Widner Rainbow Oscillator helps to predict the changes in the market trend and to follow trends. The oscillator is derived from a consensus of trends that, when plotted in color, has the appearance of a rainbow. It offers only two possible states, the upward and the downward. The Rainbow Oscillator is based on the Rainbow charts trend and is just like the Rainbow Moving Average charts. It works on the basis of a two-period moving average and its graph also helps to identify the highest high value and the lowest low value among moving averages. The Rainbow Oscillator is a simple indicator used to forecast trend reversal. It is a simple yet very important technical analysis tool. The oscillator works on the same rules as does the Rainbow indicator. It uses two simple moving averages, HHV and LLV. The Rainbow Oscillator creates an oscillator with bandwidth lines. Although it is a relatively new indicator but has become very popular for effectively forecasting the changes in the trend direction. The Rainbow Oscillator appears as a director of the trend as it follows the ups and downs of the market. The growing width of the Rainbow indicates that the current trend is likely to continue. The values of the Rainbow Oscillator beyond 80 suggest an unstable market and prone to a sudden reversal of the current market trend. On the other hand, when the prices move to the Rainbow and the Rainbow Oscillator begins to become flat, it indicates that the market is stable and the bandwidth decreases. The Rainbow Oscillator values falling below 20 again indicate an unstable market and also prone to a sudden reversal of the current trend in the market.
In simple words, we can derive the following rules.
- The Rainbow Oscillator’s wider width suggests a continuation of the current trend.
The Rainbow Oscillator between -50 and +50 indicates a stable trend.
When traveling beyond 80, the Rainbow Oscillator suggests an unstable market and a possible reversal of the current trend.
The Rainbow Oscillator traveling below 20 also indicates instability and a potential reversal of the current market trend.
Key Signal
PosNeg --> Rainbow Oscillator Output.
Labels and alerts are added.
Remarks
This is a Level 1 free and open source indicator.
Feedbacks are appreciated.
Nota Keluaran
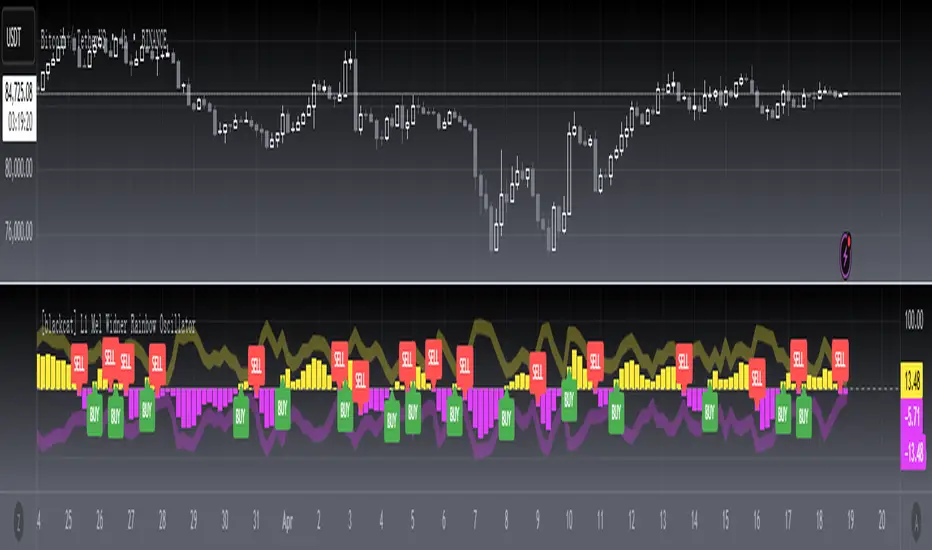
OVERVIEWThe L1 Mel Widner Rainbow Oscillator is a custom indicator designed for TradingView that provides a visual representation of market trends using a unique oscillating pattern. This script calculates and plots two main components: the Rainbow Bands and the Rainbow Oscillator. The Rainbow Bands help identify the upper and lower boundaries of price movements, while the Rainbow Oscillator indicates the momentum and potential reversal points in the market. This tool is particularly useful for traders looking to identify trend reversals and potential entry/exit points.
FEATURES
🌈 Rainbow Bands: Plots the upper and lower boundaries of price movements.
📈 Rainbow Oscillator: Indicates market momentum and potential reversal points.
🔄 Customizable Parameters: Allows users to adjust the price source, smoothing length, and level.
🎯 Buy/Sell Signals: Generates buy and sell signals based on crossover and crossunder conditions.
🔔 Alerts: Provides alerts for long and short conditions.
HOW TO USE
Add the Script: Copy and paste the script into the Pine Editor on TradingView.
Set Parameters:
Price Source: Select the price source (e.g., close, open, high, low).
Smoothing Length: Adjust the smoothing length to control the sensitivity of the indicator.
Level: Set the level to determine the range for calculating the highest and lowest prices.
Interpret the Plots:
Rainbow Bands: Observe the upper and lower bands to understand the price range.
Rainbow Oscillator: Look for crossovers above or below the zero line for buy/sell signals.
Use Alerts: Enable alerts to receive notifications for potential trading opportunities.
LIMITATIONS
The indicator may generate false signals in highly volatile or ranging markets.
Customization of parameters is essential for optimal performance.
Backtesting is recommended to validate the effectiveness of the indicator in different market conditions.
NOTES
The script uses the ALMA (Arnaud Legoux Moving Average) for smoothing the Rainbow Oscillator.
The indicator is designed to work with any timeframe but may require adjustments for different assets.
Always combine this indicator with other analysis tools for more reliable trading decisions.
Skrip sumber terbuka
Dalam semangat TradingView sebenar, pencipta skrip ini telah menjadikannya sumber terbuka, jadi pedagang boleh menilai dan mengesahkan kefungsiannya. Terima kasih kepada penulis! Walaupuan anda boleh menggunakan secara percuma, ingat bahawa penerbitan semula kod ini tertakluk kepada Peraturan Dalaman.
Avoid losing contact!Don't miss out! The first and most important thing to do is to join my Discord chat now! Click here to start your adventure: discord.com/invite/ZTGpQJq 防止失联,请立即行动,加入本猫聊天群: discord.com/invite/ZTGpQJq
Penafian
Maklumat dan penerbitan adalah tidak bertujuan, dan tidak membentuk, nasihat atau cadangan kewangan, pelaburan, dagangan atau jenis lain yang diberikan atau disahkan oleh TradingView. Baca lebih dalam Terma Penggunaan.