OPEN-SOURCE SCRIPT
Connors RSI Test
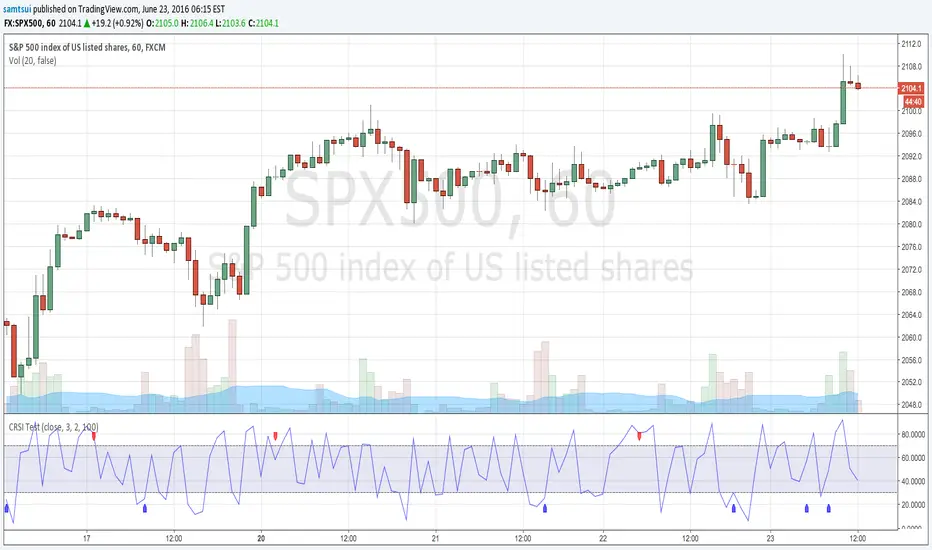
Re Fade2Black request:
The indicator needs to use Connors RSI on candle stick charts.
It basically needs to give an alert if the candle stick closes even or up but the Conors RSI closes down more than 3 points.
Here's a pic showing..
tinypic.com/r/2j62z5v/9
And on the flip side I also need it to give an alert if the candle closes even or down but the conors rsi close up more than 3 points.
Like this..
tinypic.com/r/imjod4/9
I hope I've explained myself well. Let me know how much you'd charge for this.
Thanks
Skrip sumber terbuka
Dalam semangat sebenar TradingView, pencipta skrip ini telah menjadikannya sumber terbuka supaya pedagang dapat menilai dan mengesahkan kefungsiannya. Terima kasih kepada penulis! Walaupun anda boleh menggunakannya secara percuma, ingat bahawa menerbitkan semula kod ini adalah tertakluk kepada Peraturan Dalaman kami.
Penafian
Maklumat dan penerbitan adalah tidak dimaksudkan untuk menjadi, dan tidak membentuk, nasihat untuk kewangan, pelaburan, perdagangan dan jenis-jenis lain atau cadangan yang dibekalkan atau disahkan oleh TradingView. Baca dengan lebih lanjut di Terma Penggunaan.