OPEN-SOURCE SCRIPT
Chaikin Bull-Power Oscillator
This indicator is given with much love and care to the community to help you in your trading operations.
How to use the "Chaikin-Bull-PW" Indicator
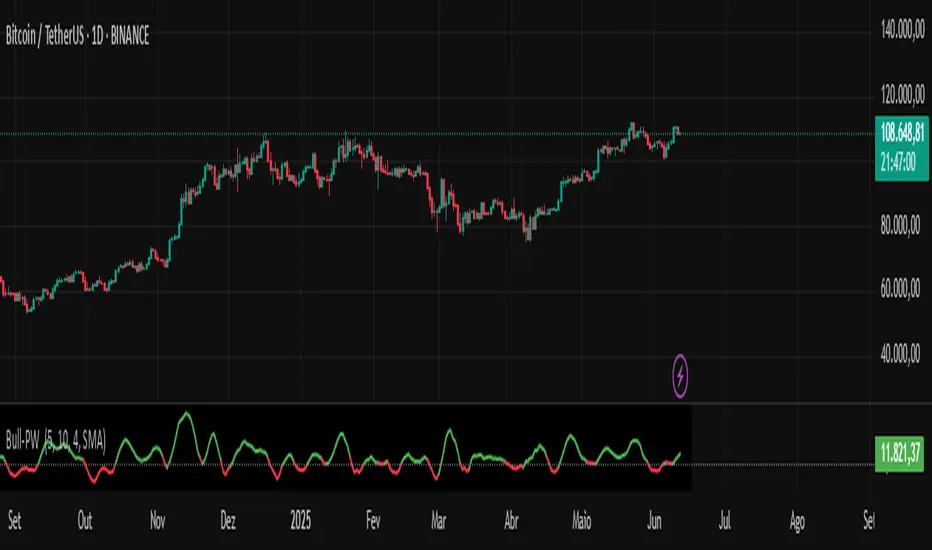
The Chaikin-Bull-PW is an oscillator based on the Accumulation/Distribution (AD) line smoothed by different methods, called here the "Hull Chaikin Oscillator." It compares two smoothed averages of the AD line — a short period and a long period — to indicate the strength and direction of buying and selling pressure in the market.
Adjustable Parameters:
Short Period: Number of bars used to calculate the short smoothed average of the AD line. Shorter periods make the indicator more sensitive.
Long Period: Number of bars used to calculate the long smoothed average of the AD line. Longer periods smooth the indicator more.
Background Offset: Controls the offset of the chart’s background color.
Smoothing Type: Choose the smoothing method for the AD line among HMA, SMA, SMMA, EMA, WMA, and JMA. This affects how the averages are calculated and how the oscillator responds to price.
Indicator Interpretation:
The oscillator is the difference between the short and long smoothed averages of the AD line.
When the oscillator is above zero (green), it indicates increasing buying pressure, suggesting an uptrend.
When the oscillator is below zero (red), it indicates increasing selling pressure, suggesting a downtrend.
The zero line acts as a reference for trend changes.
Usage Suggestions:
Use the oscillator crossing the zero line to identify potential entry or exit points.
Combine with other indicators or chart analysis to confirm signals.
Adjust the periods and smoothing type to fit your asset and timeframe.
How to use the "Chaikin-Bull-PW" Indicator
The Chaikin-Bull-PW is an oscillator based on the Accumulation/Distribution (AD) line smoothed by different methods, called here the "Hull Chaikin Oscillator." It compares two smoothed averages of the AD line — a short period and a long period — to indicate the strength and direction of buying and selling pressure in the market.
Adjustable Parameters:
Short Period: Number of bars used to calculate the short smoothed average of the AD line. Shorter periods make the indicator more sensitive.
Long Period: Number of bars used to calculate the long smoothed average of the AD line. Longer periods smooth the indicator more.
Background Offset: Controls the offset of the chart’s background color.
Smoothing Type: Choose the smoothing method for the AD line among HMA, SMA, SMMA, EMA, WMA, and JMA. This affects how the averages are calculated and how the oscillator responds to price.
Indicator Interpretation:
The oscillator is the difference between the short and long smoothed averages of the AD line.
When the oscillator is above zero (green), it indicates increasing buying pressure, suggesting an uptrend.
When the oscillator is below zero (red), it indicates increasing selling pressure, suggesting a downtrend.
The zero line acts as a reference for trend changes.
Usage Suggestions:
Use the oscillator crossing the zero line to identify potential entry or exit points.
Combine with other indicators or chart analysis to confirm signals.
Adjust the periods and smoothing type to fit your asset and timeframe.
Skrip sumber terbuka
Dalam semangat TradingView sebenar, pencipta skrip ini telah menjadikannya sumber terbuka, jadi pedagang boleh menilai dan mengesahkan kefungsiannya. Terima kasih kepada penulis! Walaupuan anda boleh menggunakan secara percuma, ingat bahawa penerbitan semula kod ini tertakluk kepada Peraturan Dalaman.
Penafian
Maklumat dan penerbitan adalah tidak bertujuan, dan tidak membentuk, nasihat atau cadangan kewangan, pelaburan, dagangan atau jenis lain yang diberikan atau disahkan oleh TradingView. Baca lebih dalam Terma Penggunaan.