OPEN-SOURCE SCRIPT
Telah dikemas kini Market Performance Table

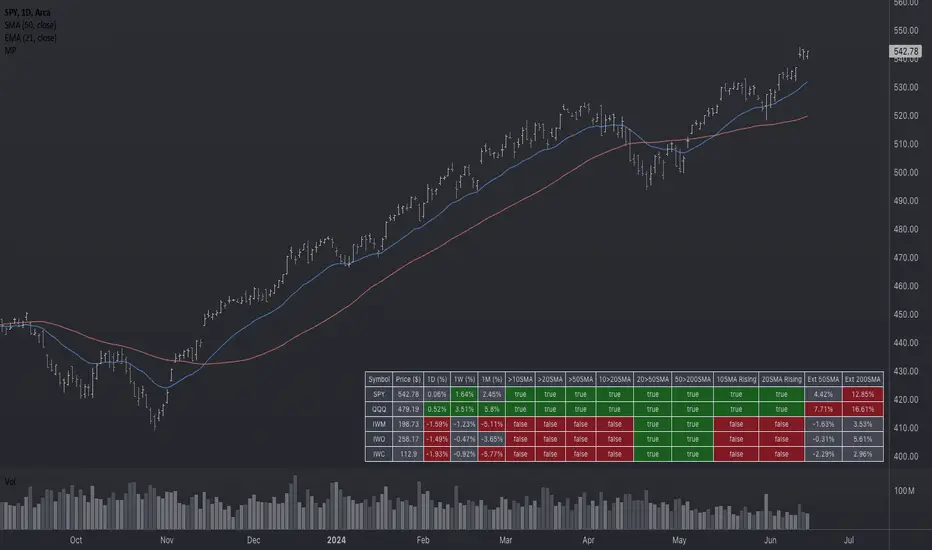
The Market Performance Table displays the performance of multiple tickers (up to 5) in a table format. The tickers can be customized by selecting them through the indicator settings.
The indicator calculates various metrics for each ticker, including the 1-day change percentage, whether the price is above the 50, 20, and 10-day simple moving averages (SMA), as well as the relative strength compared to the 10/20 SMA and 20/50 SMA crossovers. It also calculates the price deviation from the 50-day SMA.
The table is displayed on the chart and can be positioned in different locations.
Credits for the idea to Alex_PrimeTrading ;)
Nota Keluaran
Update Version 2.0Switch Between SMA and EMA:
- Added an option to toggle between Simple Moving Average (SMA) and Exponential Moving Average (EMA) for all calculations.
- The column titles dynamically change based on the selected moving average type.
1-Week and 1-Month Rate of Change:
- Added columns to display the 1-week (5 days) and 1-month (21 days) rate of change percentages.
Reordered Columns:
- Changed the order of the moving average columns from [>50, >20, >10] to [>10, >20, >50] for better readability.
Background Color for Change Columns:
- Implemented color-coding for the rate of change columns based on thresholds:
- 1-Day Change: Green if > 0.1%, Red if < 0%, Gray otherwise.
- 1-Week Change: Green if > 1%, Red if < 0%, Gray otherwise.
- 1-Month Change: Green if > 5%, Red if < 0%, Gray otherwise.
Extension Thresholds for 50 and 200 Moving Averages:
- Added input options for setting thresholds for the extension percentages from the 50-period and 200-period moving averages.
- The color coding is reversed based on these thresholds:
- Red if above the positive threshold.
- Green if below the negative threshold.
- Gray otherwise.
Rising Moving Averages:
- Added indicators to show if the 10-period and 20-period moving averages are rising from the previous day.
Enhanced Color Customization:
- Updated the color variables for bullish, bearish, and neutral cells.
- Adjusted transparency settings for better visual clarity.
Skrip sumber terbuka
Dalam semangat sebenar TradingView, pencipta skrip ini telah menjadikannya sumber terbuka supaya pedagang dapat menilai dan mengesahkan kefungsiannya. Terima kasih kepada penulis! Walaupun anda boleh menggunakannya secara percuma, ingat bahawa menerbitkan semula kod ini adalah tertakluk kepada Peraturan Dalaman kami.
Penafian
Maklumat dan penerbitan adalah tidak dimaksudkan untuk menjadi, dan tidak membentuk, nasihat untuk kewangan, pelaburan, perdagangan dan jenis-jenis lain atau cadangan yang dibekalkan atau disahkan oleh TradingView. Baca dengan lebih lanjut di Terma Penggunaan.