OPEN-SOURCE SCRIPT
Telah dikemas kini LiquidityFlow Dominance+Alerts (btc.d, T3, Stables)
LiquidityFlow Dominance+Alerts: Overview & Usage Guide
Overview
The LiquidityFlow Dominance+Alerts indicator provides a dynamic view of liquidity flow across Bitcoin, Altcoins, and Stablecoins, helping track liquidity shifts and identify market sentiment. By integrating moving averages, custom alerts, and thresholds for extreme outliers, this indicator helps to anticipate bullish and bearish shifts in liquidity and alert market tops and bottoms.
Key features include:
1. Liquidity Flow Monitoring: Track liquidity flow across Bitcoin (BTC), Altcoins (TOTAL3), and Stablecoins (USDT, USDC, DAI).
2. Custom Alerts: Set alerts for key liquidity shifts and extreme conditions in Stablecoin dominance, both with static and moving average (MA)-based calculations.
3. Moving Averages: Use Simple, Exponential, or Weighted Moving Averages to smooth out market data for more reliable signals.
4. Outlier Detection: Identify potential tops and bottoms using thresholds for Stablecoin dominance, with alerts for extreme movements.
Functionality
Data Inputs and Key Metrics
- Symbols Monitored:
- Bitcoin Dominance (BTC.D)
- Altcoin Market Cap (TOTAL3)
- Stablecoins (USDT.D, USDC.D, DAI.D)
- Liquidity Flow Conditions:
- Track percentage changes in dominance across sectors to detect liquidity flow into Bitcoin, Altcoins, or Stablecoins.
- Custom Metrics:
- Liquidity Flow Index: BTC Dominance minus Stablecoin Dominance.
- Liquidity Flow Ratio: BTC Dominance divided by the combined dominance of Stablecoins and Altcoins.
Moving Average Integration
- Select from SMA, EMA, or WMA to apply moving averages to the dominance metrics. Moving averages help smooth out short-term volatility and provide more consistent signals.
- Moving averages are applied to each sector (BTC, Altcoins, and Stablecoins) and compared to their previous period values to determine shifts in liquidity.
Alerts and Thresholds
- % Change Lookback Period: Adjust the lookback period to align with the timeframe of your chart. Shorter timeframes may require a lower lookback period, while higher timeframes may benefit from longer periods.
- Stables Bull/Bear % for Alerts: Set a threshold for when Stablecoin dominance becomes a bullish or bearish signal relative to BTC and Altcoins. A higher threshold may be used in volatile markets to filter out noise.
- Extreme Outliers Detection: Use the **Stables Up/Down Extreme Threshold** to identify potential market tops or bottoms when Stablecoin dominance deviates significantly from historical trends. The **Extreme Lookback Period** controls the time window for detecting these anomalies.
How to Use the Indicator
Adjusting the % Change Lookback Period
- The `% Change Lookback Period` should be adjusted based on your chart’s timeframe. For example, a shorter period (e.g., 7) works well for intraday charts, while longer periods (e.g., 14) might be more suitable for daily or weekly charts.
Setting Thresholds for Alerts
- Stables Bull/Bear % for Alerts: Adjust this setting to define when Stablecoin dominance triggers bullish or bearish alerts. A value like 1% could be a good starting point for most market conditions but can be fine-tuned based on volatility.
- Extreme Lookback Period: Define the lookback period for detecting extreme moves in Stablecoin dominance. This will help identify major tops and bottoms in the market. For shorter-term trades, consider using a shorter extreme lookback (e.g., 7-10 periods).
Alerts for Liquidity Shifts
- The indicator supports alerts for key liquidity shifts, which are useful for staying ahead of market movements. Alerts can be set to notify you when liquidity moves into:
- Bitcoin: Indicating a potential bullish trend for Bitcoin.
- Altcoins: Signaling altcoins are bullish.
- Stablecoins: Suggesting a risk-off environment or market correction.
Extreme Alerts for Stables
- Extreme Up/Down Alerts: These are triggered when Stablecoin dominance crosses extreme thresholds. For example, if Stablecoin dominance rises more than 14% over a set period, it could signal a market top, while a significant drop could indicate a market bottom.
Moving Average Calculations
- In addition to static percentage changes, moving averages can be applied to smooth out dominance values. The type and length of the moving average can be customized:
- SMA (Simple Moving Average): Best for smoothing out volatility in a linear way.
- EMA (Exponential Moving Average): More responsive to recent data, making it useful in faster markets.
- WMA (Weighted Moving Average): Emphasizes more recent data, but less reactive than the EMA.
Additional Usage Tips:
- Background Colors: The indicator visually highlights the dominant liquidity flow:
- Orange: Liquidity is shifting toward Bitcoin.
- Aqua: Liquidity is flowing into Altcoins.
- Red: Liquidity is moving into Stablecoins.
Nota Keluaran
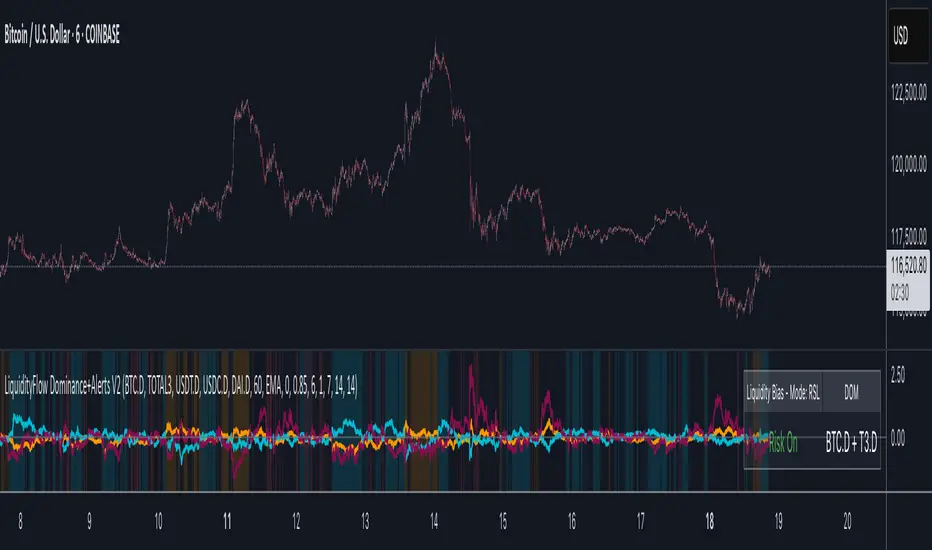
🌊 LiquidityFlow Dominance+Alerts V2Advanced Market Regime & Liquidity Flow Analysis with Alerts
🔎 Overview
The LiquidityFlow Dominance+Alerts V2 indicator provides a dynamic view of liquidity flows across Bitcoin, Altcoins, and Stablecoins, designed to detect money shifts, track market sentiment, and anticipate regime changes.
Version 2 introduces Relative Strength Levy (RSL) momentum analysis, which compares dominance values against moving averages for smoother, faster, and more reliable signals than traditional percentage change metrics.
🚀 Key Features
📊 Liquidity Flow Monitoring
BTC Dominance (BTC.D) – Safe haven / store-of-value flows
Altcoin Market Cap (TOTAL3) – Risk-on / speculative flows
Stablecoins (USDT.D, USDC.D, DAI.D) – Risk-off / cash-positioning flows
🧠 Dual Analysis Modes
RSL Mode (default): Detects momentum relative to moving averages (noise-filtered).
Traditional Mode: Classic percentage-change liquidity calculations.
One-Click Toggle: Instantly compare both perspectives.
🎯 Smart Market Regime Detection
Risk-On Signals: Flows into BTC or Altcoins.
Risk-Off Signals: Flows into Stablecoins.
Professional Regime Table: Clean visual panel showing current dominance shifts.
⚡ Performance Optimized
Optimized Data Caching: Up to ~80% fewer security request calls.
13 Advanced Moving Averages: EMA, DEMA, TEMA, HMA, McGinley Dynamic, ALMA, and more.
Error Handling: Stable calculations across all market conditions.
🔔 Intelligent Alert System
Liquidity Shift Alerts: Instant notifications when flows change direction.
Threshold-Based Alerts: Adjustable sensitivity for bull/bear regime shifts.
Extreme Condition Alerts: Early warnings of market tops/bottoms.
Clear Messages: Alerts include contextual explanations for fast decisions.
📈 How RSL Analysis Works
Traditional Analysis: Compares current vs. historical levels (lag-prone, noisy).
RSL Analysis: Compares dominance vs. its moving average (smooth, responsive).
Interpretation:
RSL > 0% → Dominance stronger than MA → Bullish momentum
RSL < 0% → Dominance weaker than MA → Bearish momentum
Distance from 0% → Magnitude of trend strength
🎛️ Customization Options
Lookback Period: Default 60 (optimized for RSL), adjustable 1–200.
Moving Averages: Choose from 13 methods (SMA, EMA, McGinley, ALMA, etc.).
Alert Thresholds: From conservative (2%+) to aggressive (0.3%+).
Visuals: Toggle regime table, background highlights, and zero-line references.
Advanced Settings: ALMA tuning, LSMA offsets, extreme detection controls.
🎯 Trading Applications
🟢 Risk-On (Buy/Long Bias):
BTC Dominance rising + Altcoin strength
Stablecoin dominance falling
RSL > 0% for BTC/Alts
🔴 Risk-Off (Sell/Hedge Bias):
Stablecoin dominance rising
BTC + Alt dominance falling
Extreme Stablecoin alerts = regime shift
⚪ Neutral / Transition:
Mixed signals = consolidation phase
Low RSL = weak momentum → avoid trend strategies
🏆 Why This Indicator Stands Out
First-of-its-kind: Combines liquidity flow analysis with RSL momentum
Comprehensive Coverage: Bitcoin, Altcoins, Stablecoins
Performance-Tuned: Smooth, efficient, reliable
Adaptable: Configurable for swing traders, day traders, scalpers, and analysts
Skrip sumber terbuka
Dalam semangat TradingView sebenar, pencipta skrip ini telah menjadikannya sumber terbuka, jadi pedagang boleh menilai dan mengesahkan kefungsiannya. Terima kasih kepada penulis! Walaupuan anda boleh menggunakan secara percuma, ingat bahawa penerbitan semula kod ini tertakluk kepada Peraturan Dalaman.
Penafian
Maklumat dan penerbitan adalah tidak bertujuan, dan tidak membentuk, nasihat atau cadangan kewangan, pelaburan, dagangan atau jenis lain yang diberikan atau disahkan oleh TradingView. Baca lebih dalam Terma Penggunaan.