OPEN-SOURCE SCRIPT
Telah dikemas kini Price and Volume Divergence Analyzer
How to Use the Indicator
Main Purpose:
Identify divergences between price movement, the volume line, and the weighted volume line to predict potential reversals.
Volume Line Explanation:
At zero: Equal buying and selling volume.
At 1: Double the buying volume vs. selling.
At -1: Double the selling volume vs. buying.
Divergence:
Price rising, volume line falling: Sellers offloading to buyers—likely reversal downward.
Price falling, volume line rising: Buyers stepping in—likely reversal upward.
Higher/Lower Volume Movement Line:
At zero: Equal volume required for price movement.
At 1: High efficiency—half the volume needed to move price.
At -1: Low efficiency—double the volume needed to move price.
Above volume line: Movement aligns with efficient volume.
Below volume line: Inefficient price movement.
Candle Fill Colors:
Shaded based on whether the current close is higher or lower than the previous close.
Settings Overview
EMA Settings:
Timeframe Selection:
Use a lower timeframe than your chart for accuracy. Avoid selecting a timeframe higher than your chart.
EMA Length Option:
Default: Sets lengths automatically (EMA = 14, EMA of EMA = 3).
User Input: Allows custom EMA length.
Calculation Type:
EMA: Standard exponential moving average.
EMA of EMA: Applies EMA three times for smoother values.
Volume Line Settings:
Line Width: Adjust thickness.
Colors:
More Buying: Green (default).
More Selling: Red (default).
Higher/Lower Volume Movement Line:
Line Width: Adjust thickness.
Colors:
Higher Volume Movement: Indicates higher volume required.
Lower Volume Movement: Indicates lower volume required.
Up/Down Candle Fill:
Colors:
Up Candle: Green (default).
Down Candle: Red (default).
Transparency: Adjust percentage for visibility.
Balance Line Settings:
Line Width and Color: Equilibrium line showing equal buying/selling volume at zero.
Nota Keluaran
Added Features:
• Percent Rank Volume squares at the top.
• RSI squares at the bottom.
• Legend with values and colors corresponding to RSI and Percent Rank levels (0 to 100).
• On/Off display buttons for portions of the indicator.
• Balance line style option.
RSI Levels:
Oversold: Dark purple, pink, red, orange.
Midpoint: Yellow.
Overbought: Green, cyan, blue, dark blue.
Volume Percent Rank:
Low Volume: Dark purple, pink, red, orange.
Midpoint (Average Volume): Yellow.
High Volume: Green, cyan, blue, dark blue.
Nota Keluaran
Updated Script Overview:Use lower timeframes than your chart's.
Additional moving average options for volume and price-weighted lines.
Buy/Sell Volume Ratio Line (Green/Red):
Above zero (green): More trades closed higher than the previous close.
Below zero (red): More trades closed lower than the previous close.
If the buy/sell ratio line reaches 1, all trades within the candle session closed higher than the previous close.
If the buy/sell ratio line reaches -1, all trades within the candle session closed lower than the previous close.
Buy/Sell Dominant Line:
Turns blue when above the buy/sell ratio line, indicating greater upward movement per volume.
Turns purple when below the buy/sell ratio line, indicating greater downward movement per volume.
Fill Type Options:
Volume buying vs selling colors
Candle up and candle down colors
Buying vs Selling Color Logic:
Green fill:
Buyer/seller ratio line is above zero (more buys).
Buy/sell dominant is above the ratio line (easier to move up).
Yellow fill:
Same as green, but buy/sell dominant is below the ratio line (easier to move down).
Red fill:
Buyer/seller ratio line is below zero (more sells).
Buy/sell dominant is below the ratio line (easier to move down).
Orange fill:
Same as red, but buy/sell dominant is above the ratio line (easier to move up).
Percent Rank:
Remapped from 0-100 to -50 (lowest volume) to 50 (highest volume).
Nota Keluaran
Added standard EMA.Nota Keluaran
updated Legend.Nota Keluaran
corrected fill color system.Nota Keluaran
When up volume is equal to down it is now split between the two.Nota Keluaran
Indicator OverviewThis update better reflects the original intent. If you have an account that can access one second data, it is recommended to change the setting to pull data from the 1 second timeframe onwards, otherwise leave it as 1 minute onwards.
Move Strength
Formula: Price % change × √Volume
Represents the intensity of price movement factoring in volume
Accumulation:
If price rises, the value is added to buys
If price falls, the value is added to sells
Strength Ratio: Buys / Sells, indicating relative buying vs. selling pressure
Distance per Volume.
Formula: Price movement / Volume
Measures how much price moves relative to the amount of volume used
Interpretation:
High values: Price moves easily with little volume, suggesting efficiency
Low values: Price struggles to move with low volume, indicating weakness
Mid-range values: Price movement is balanced in both directions
Percent Rank Lines
Move Strength: Ranges from 0 to 50 (50 = 100%)
Distance per Volume: Ranges from 0 to -50 (-50 = 100%, ignore the negative sign)
Meaning: Higher values indicate current conditions are stronger compared to historical occurrences
Extras
RSI dots appear when price reaches overbought or oversold levels
Label displays the current Move Strength & Distance per Volume
Move Strength > 0: More trades occurred during price increases than decreases
Same logic applies to Distance per Volume
Interpretation Tips
There are no strict buy/sell signals, but you can look for key conditions:
Potential Buy Signal:
Distance per Volume remains consistently high (>1) while price stays low
Move Strength is rising while price is falling (bullish divergence)
Potential Exit Signal:
Distance per Volume starts declining
RSI signals overbought
Move Strength begins turning down
Price remains high despite weakening momentum
By analyzing these factors together, you can better gauge the efficiency and strength of price movements.
Nota Keluaran
Fixed minor bug.Nota Keluaran
This indicator has been updated to separate the buy and sell volume by looking at smaller timeframes.
When the close price is higher than than the previous close price, this will be considered as buy volume otherwise sell volume.
The indicator has two sections. The top half and bottom of this indicator are mirrored buy and sell volume amounts except each have their own colors and moving average lengths that can be adjusted separately.
The default buy volume color is green and sell volume color is red.
An example how one would use this indicator:
If you're on the one hour chart, and a new candle has just formed.
The price begins to move up along with the green volume bar. However, the price begins to slow down. The green volume bar also slows towards 5000 units of volume (or dollar value). You then notice in front of the green volume bar, the red selling bar begins to rise. As it approaches 5000, the red volume bar goes behind the green volume bar and coninutes up reaching 8500. Once that candle finalises, the volume bars would have been complied of 60 one minute candles (free trading view accounts) or 3600 seconds (preimum accounts).
This now tells us there was more selling than buying. The status line will show a green 5000, the absolute value difference (purple) of 3500 (blue for gain, purple for loss), and a red amount of 8500.
So to summarize, the lower volume out of the buys and sells will be in front and the higher volume will be behind.
The bottom part of the indicator is the same as above but with different colors and a moving average length that helps see gradually buying or selling increase or decrease. The buy volume is blue and purple volume is purple for the bottom half of the indicator.
The options:
volume type:
• buy and sell dollar value (close * volume)
• buy and sell volume
timeframe selector: (if you have a premium account, make sure to change this to "use premium account timeframes")
• use free account timeframes (smallest timeframe is one minute)
• use paid account timeframes (default smallest timeframe is set to 1 second for granularity of volume)
"TF1 to TF10" are the timeframes that premium accounts can change.
Top moving average:
• moving average length: 1 (Setting of 1 does not apply the moving average. It's best not to change this as it will show you the current candle's volume of buys and sells.
Bottom moving average:
Is the same as above but with different colours. Feel free to change the moving average to get an idea of when buy and sell volume either increases, decreases or spikes and so on.
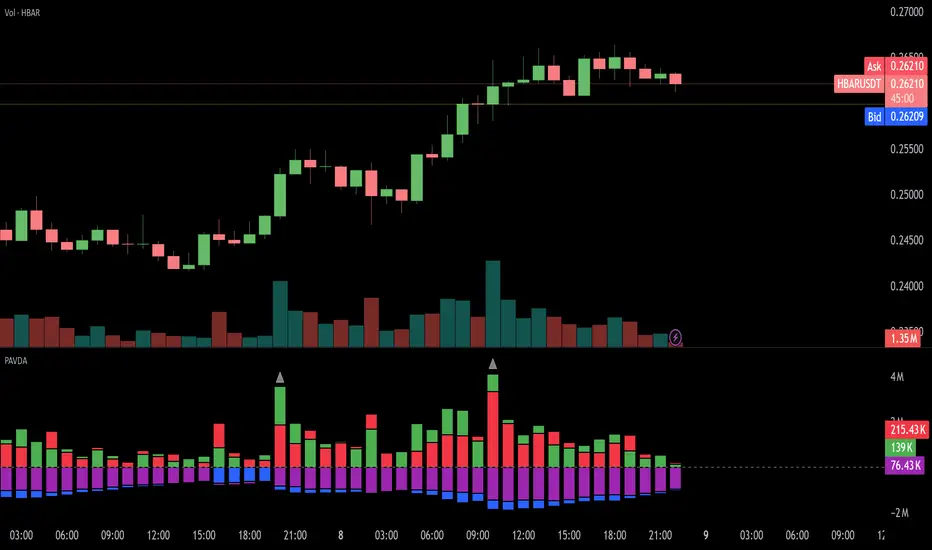
Percent ranks:
Will display triangles pointing down ▼ for low volume and a triangle pointing up ▲ for high volume.
The low and high volume buys will be displayed above the midline (zero horizontal line).
The low and high volume sells will be displayed below the midline.
These triangles will only appear once they go below or above the volume percent rank levels.
"High volume with a real body below this percent rank" will display a label once the buy or sell volume is above or equal to the high percent rank and the real body size is below or equal to the percent chosen.
"Gain/Loss in status line" Is the absolute value of the buy volume minus the sell volume. To distinguish whether it is a gain or loss use the colours.
Nota Keluaran
Spelling corrections.Skrip sumber terbuka
Dalam semangat TradingView sebenar, pencipta skrip ini telah menjadikannya sumber terbuka, jadi pedagang boleh menilai dan mengesahkan kefungsiannya. Terima kasih kepada penulis! Walaupuan anda boleh menggunakan secara percuma, ingat bahawa penerbitan semula kod ini tertakluk kepada Peraturan Dalaman.
Penafian
Maklumat dan penerbitan adalah tidak bertujuan, dan tidak membentuk, nasihat atau cadangan kewangan, pelaburan, dagangan atau jenis lain yang diberikan atau disahkan oleh TradingView. Baca lebih dalam Terma Penggunaan.
Skrip sumber terbuka
Dalam semangat TradingView sebenar, pencipta skrip ini telah menjadikannya sumber terbuka, jadi pedagang boleh menilai dan mengesahkan kefungsiannya. Terima kasih kepada penulis! Walaupuan anda boleh menggunakan secara percuma, ingat bahawa penerbitan semula kod ini tertakluk kepada Peraturan Dalaman.
Penafian
Maklumat dan penerbitan adalah tidak bertujuan, dan tidak membentuk, nasihat atau cadangan kewangan, pelaburan, dagangan atau jenis lain yang diberikan atau disahkan oleh TradingView. Baca lebih dalam Terma Penggunaan.