PROTECTED SOURCE SCRIPT
ATR + Fibs
Description:
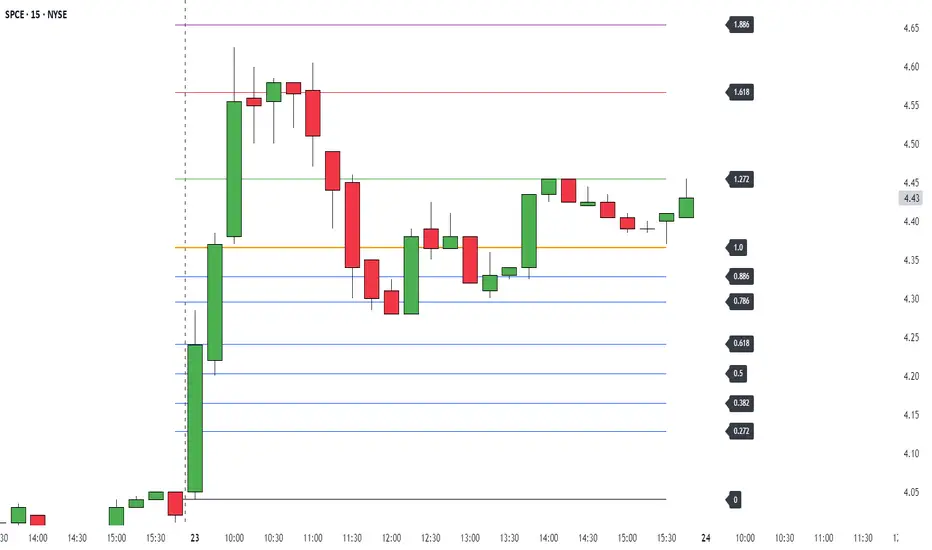
This script plots ATR levels and ATR-based Fibonacci extension levels from either the Low of Day, or High of Day, using the daily Average True Range (ATR) to project key price zones. It's designed to help traders quickly assess where price is trading relative to the day’s ATR.
Features:
Visual reference for how far price has moved relative to today's ATR
Projects fib levels using daily ATR from LOD or HOD
Optional display of fib lines, % labels, and price values
Customizable colors and line widths per level
Auto-resets daily with updated highs/lows
Works on all intraday and higher timeframes
Ideal for traders who want to gauge intraday extension, or frame entries using volatility-based levels.
Skrip dilindungi
Skrip ini diterbitkan sebagai sumber tertutup. Akan tetapi, anda boleh menggunakannya secara bebas dan tanpa apa-apa had – ketahui lebih di sini.
Penafian
Maklumat dan penerbitan adalah tidak bertujuan, dan tidak membentuk, nasihat atau cadangan kewangan, pelaburan, dagangan atau jenis lain yang diberikan atau disahkan oleh TradingView. Baca lebih dalam Terma Penggunaan.