TradeChartist Tracker
===================================================================================================================
™𝗧𝗿𝗮𝗱𝗲𝗖𝗵𝗮𝗿𝘁𝗶𝘀𝘁 𝗧𝗿𝗮𝗰𝗸𝗲𝗿 𝗨𝘀𝗲𝗿 𝗠𝗮𝗻𝘂𝗮𝗹
=====================================
™TradeChartist Tracker Plot Types
==============================
1. Indicator plot of Chart Symbol on its own, chosen from the 𝗜𝗻𝗱𝗶𝗰𝗮𝘁𝗼𝗿 𝗧𝘆𝗽𝗲 dropdown, enabling 𝐃𝐢𝐬𝐩𝐥𝐚𝐲 𝐈𝐧𝐝𝐢𝐜𝐚𝐭𝐨𝐫 𝐏𝐥𝐨𝐭 (𝐝𝐢𝐬𝐚𝐛𝐥𝐞𝐬 𝐓𝐫𝐚𝐜𝐤𝐞𝐫/𝐒𝐜𝐨𝐫𝐞𝐜𝐚𝐫𝐝).
In this example Daily chart of XRP-USDT, 55 period Stochastic is tracked for the chart symbol XRP-USDT.
2. Indicator plot of a Symbol different from the Chart Symbol, chosen from the 𝗜𝗻𝗱𝗶𝗰𝗮𝘁𝗼𝗿 𝗧𝘆𝗽𝗲 dropdown by enabling Tʀᴀᴄᴋ ᴀɴᴏᴛʜᴇʀ Sʏᴍʙᴏʟ's Iɴᴅɪᴄᴀᴛᴏʀ and entering the symbol name in the Sʏᴍʙᴏʟ ᴛᴏ Tʀᴀᴄᴋ input box, whilst keeping 𝐃𝐢𝐬𝐩𝐥𝐚𝐲 𝐈𝐧𝐝𝐢𝐜𝐚𝐭𝐨𝐫 𝐏𝐥𝐨𝐭 (𝐝𝐢𝐬𝐚𝐛𝐥𝐞𝐬 𝐓𝐫𝐚𝐜𝐤𝐞𝐫/𝐒𝐜𝐨𝐫𝐞𝐜𝐚𝐫𝐝) enabled.
In this example Daily chart of XRP-USDT, 55 period Stochastic is tracked for the BTC-USD (different from chart symbol XRP-USDT).
3. Tracker Plot of up to 10 Multiple Symbol Trackers for the Indicator chosen from the 𝗜𝗻𝗱𝗶𝗰𝗮𝘁𝗼𝗿 𝗧𝘆𝗽𝗲 dropdown, by disabling 𝐃𝐢𝐬𝐩𝐥𝐚𝐲 𝐈𝐧𝐝𝐢𝐜𝐚𝐭𝐨𝐫 𝐏𝐥𝐨𝐭 (𝐝𝐢𝐬𝐚𝐛𝐥𝐞𝐬 𝐓𝐫𝐚𝐜𝐤𝐞𝐫/𝐒𝐜𝐨𝐫𝐞𝐜𝐚𝐫𝐝) and by entering the number of trackers required in the 𝐍𝐮𝐦𝐛𝐞𝐫 𝐨𝐟 𝐓𝐫𝐚𝐜𝐤𝐞𝐫𝐬 input box under 𝗧𝗿𝗮𝗰𝗸𝗲𝗿 𝗣𝗹𝗼𝘁𝘀 section. Upto 10 Symbols can be tracked and can be input by the user in the input boxes from Sʏᴍʙᴏʟ 1,...Sʏᴍʙᴏʟ 10. 𝐃𝐢𝐬𝐩𝐥𝐚𝐲 𝐈𝐧𝐝𝐢𝐜𝐚𝐭𝐨𝐫 𝐏𝐥𝐨𝐭 (𝐝𝐢𝐬𝐚𝐛𝐥𝐞𝐬 𝐓𝐫𝐚𝐜𝐤𝐞𝐫/𝐒𝐜𝐨𝐫𝐞𝐜𝐚𝐫𝐝) must be disabled for this plot type.
In this example Daily chart of Crypto Total Market Cap, Bollinger Bands %B is tracked for the chart symbol + 10 other Crypto symbols using Multi Symbol Trackers
4. Visual Scorecards of up to 5 Symbols for 8 indicators (all except Net Volume and HA Trend) can be plotted with real-time data by enabling 𝗗𝗶𝘀𝗽𝗹𝗮𝘆 𝗩𝗶𝘀𝘂𝗮𝗹 𝗦𝗰𝗼𝗿𝗲𝗰𝗮𝗿𝗱 - (𝟓 𝐓𝐫𝐚𝐜𝐤𝐞𝐫𝐬 𝐋𝐢𝐦𝐢𝐭). 𝐃𝐢𝐬𝐩𝐥𝐚𝐲 𝐈𝐧𝐝𝐢𝐜𝐚𝐭𝐨𝐫 𝐏𝐥𝐨𝐭 (𝐝𝐢𝐬𝐚𝐛𝐥𝐞𝐬 𝐓𝐫𝐚𝐜𝐤𝐞𝐫/𝐒𝐜𝐨𝐫𝐞𝐜𝐚𝐫𝐝) must be disabled for this plot type.
For the same example Daily chart of Crypto Total Market Cap as above, Visual Scorecard is plotted for 5 Symbols as shown.
5. Indicator Tracker labels can be plotted on Price chart by overlaying the Tracker on main chart and by switching from Separate Tracker Pane - Default to Tracker Labels only on Price Scale in the Lᴀʙᴇʟs Dɪsᴘʟᴀʏ Tʏᴘᴇ dropdown box.
In this example chart of 1hr XLM-USDT, Tracker labels of 55 EMA are plotted for 10 different symbols along with the 55 EMA plot of XLM-USDT.
Indicator plot that doesn't fit on price scale can be visualised using a second Tracker added to chart as shown in the ETH-USDT example below tracking Net Volume.
===================================================================================================================
𝗜𝗻𝗱𝗶𝗰𝗮𝘁𝗼𝗿𝘀 𝗜𝗻𝗰𝗹𝘂𝗱𝗲𝗱 𝗶𝗻 ™𝗧𝗿𝗮𝗱𝗲𝗖𝗵𝗮𝗿𝘁𝗶𝘀𝘁 𝗧𝗿𝗮𝗰𝗸𝗲𝗿
==============================================
1. Stochastic Oscillator
2. RSI
3. CCI
4. MA - (15 types included)
5. MACD
6. Bollinger Bands %B + Optional plots of Bollinger Bands and Breakout Signals
7. Ichimoku Cloud Oscillator + Optional plots of Ichimoku Cloud and Breakout Signals
8. Donchian Channels + Optional plots of Donchian Channels and Breakout Signals
9. Net Volume
10. Heikin Ashi Trend
All of the above indicators can be plotted as independent plots of the Chart Symbol or of a different symbol by enabling 𝐃𝐢𝐬𝐩𝐥𝐚𝐲 𝐈𝐧𝐝𝐢𝐜𝐚𝐭𝐨𝐫 𝐏𝐥𝐨𝐭 (𝐝𝐢𝐬𝐚𝐛𝐥𝐞𝐬 𝐓𝐫𝐚𝐜𝐤𝐞𝐫/𝐒𝐜𝐨𝐫𝐞𝐜𝐚𝐫𝐝). Some Oscillators have the option of Pʟᴏᴛ Sᴛʏʟᴇ under their relevant sections, and can be plotted as line, area or a histogram.
Oscillators 1-8 (except 4) require source price, lookback length and smoothing (where available) for the indicator plot. The colour of the tracker blocks is based on the Upper/Lower bands (where available), specified by the user in the respective sections. For example, if the RSI indicator is chosen to be plotted with Upper band at 60 and Lower band at 40, the tracker blocks and the Indicator plot paint the values between 40 and 60 in neutral colour which can be changed from the settings.
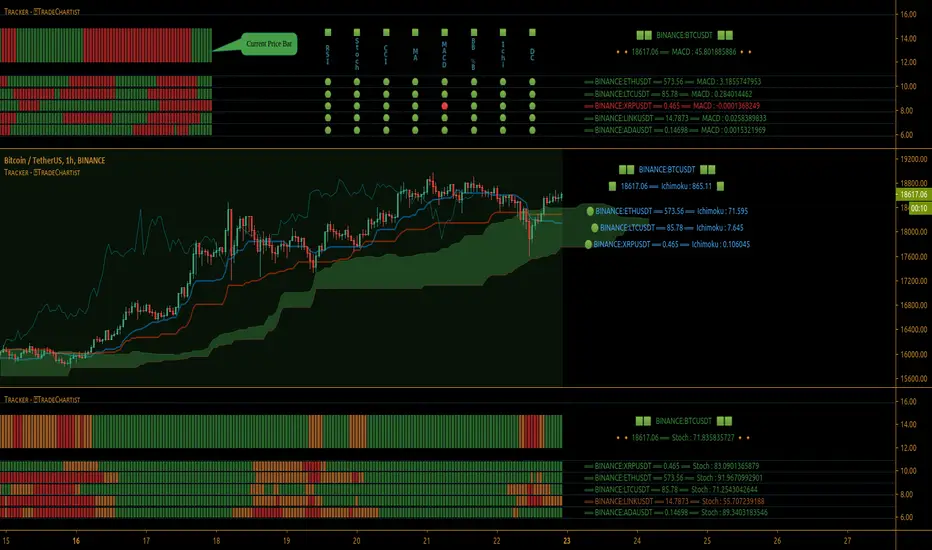
Multi Window BTC-USDT 1hr example chart below with various indicators from ™TradeChartist Tracker.
Note: The tracker colour is exactly colour of the Indicator Plot. The Visual Scorecard, however uses the mid values and doesn't take into account the bands specified by the user. For example, RSI score is green on the Visual Scorecard as long as RSI is above 50 and doesn't get affected by the user specified upper/lower band and this applies to all Oscillators. This is shown in the 1hr BTC-USDT chart below.
Moving Averages (MA) and MACD
------------------------------------------------------
Tracker plots and tracks one of 15 Moving Averages that can be chosen from the MA ᴛʏᴘᴇ and by specifying the MA Lᴇɴɢᴛʜ.
MACD uses EMA as default for calculating the MACD plots and Tracker data using Fᴀsᴛ Lᴇɴɢᴛʜ, Sʟᴏᴡ Lᴇɴɢᴛʜ and Sᴍᴏᴏᴛʜɪɴɢ. To experiment or use a different Moving Average to calculate MACD, disable 𝐔𝐬𝐞 𝐄𝐌𝐀 (Uɴᴄʜᴇᴄᴋ ᴛᴏ ᴜsᴇ MA ғʀᴏᴍ ᴀʙᴏᴠᴇ) and select the required Moving Average from MA ᴛʏᴘᴇ drop down of the 𝟰. 𝗠𝗼𝘃𝗶𝗻𝗴 𝗔𝘃𝗲𝗿𝗮𝗴𝗲 section.
Bollinger Bands %B + Optional plots of Bollinger Bands and Breakout Signals
---------------------------------------------------------------------------------------------------------------------------
Bollinger Bands %B is a companion oscillator for Bollinger Bands and helps depict where the price is, in relation to the Bollinger Bands. To plot the actual Bollinger Bands, enable Dɪsᴘʟᴀʏ Bᴏʟʟɪɴɢᴇʀ Bᴀɴᴅs and to plot the Bollinger Bands Breakout Signals, enable Sʜᴏᴡ BB Bʀᴇᴀᴋᴏᴜᴛ Sɪɢɴᴀʟs, with 𝐃𝐢𝐬𝐩𝐥𝐚𝐲 𝐈𝐧𝐝𝐢𝐜𝐚𝐭𝐨𝐫 𝐏𝐥𝐨𝐭 (𝐝𝐢𝐬𝐚𝐛𝐥𝐞𝐬 𝐓𝐫𝐚𝐜𝐤𝐞𝐫/𝐒𝐜𝐨𝐫𝐞𝐜𝐚𝐫𝐝) enabled.
Ichimoku Cloud Oscillator + Optional plots of Ichimoku Cloud and Breakout Signals
------------------------------------------------------------------------------------------------------------------------------------
Ichimoku Cloud Oscillator helps visualize the current price in relation to the breakout support/resistance of the Ichimoku Cloud using strict Ichimoku Cloud criteria (including Chikou Span agreeing with the breakout etc.). To plot the actual Ichimoku Cloud, enable Dɪsᴘʟᴀʏ Iᴄʜɪᴍᴏᴋᴜ Cʟᴏᴜᴅ and to plot the Kumo Breakout Signals, enable Sʜᴏᴡ Kᴜᴍᴏ Bʀᴇᴀᴋᴏᴜᴛ Sɪɢɴᴀʟs, with 𝐃𝐢𝐬𝐩𝐥𝐚𝐲 𝐈𝐧𝐝𝐢𝐜𝐚𝐭𝐨𝐫 𝐏𝐥𝐨𝐭 (𝐝𝐢𝐬𝐚𝐛𝐥𝐞𝐬 𝐓𝐫𝐚𝐜𝐤𝐞𝐫/𝐒𝐜𝐨𝐫𝐞𝐜𝐚𝐫𝐝) enabled.
Cloud Settings form the fundamental factor for this indicator to detect the breakouts. The settings for the Ichimoku Cloud is Automatic (detects right settings for the symbol type) by default, but this can be changed to Classic or 24/7 Crypto, based on the user preference from the settings under 𝐂𝐥𝐨𝐮𝐝 𝐓𝐲𝐩𝐞, which also includes a manual input option. Ichimoku traders can experiment different settings combinations under manual settings to suit their trading frequency and timeframe traded.
Donchian Channels + Optional plots of Donchian Channels and Breakout Signals
-------------------------------------------------------------------------------------------------------------------------------
Donchian Channels comprises of three plots - a upper band, a lower band and a mean line (or mid line of the channel). The upper band is based on highest high of N periods specified by the user and the lower band is based on the lowest low of N periods specified by the user. These channels help spot price breaching high or low of last N periods clearly, thereby aiding the trader to understand the price action of any symbol better on any given timeframe.
Donchian Channels Oscillator helps visualize the current price in relation to the Mean line of the Donchian Channels of user specified lookback period (specified in the Dᴏɴᴄʜɪᴀɴ Cʜᴀɴɴᴇʟ Lᴇɴɢᴛʜ input box). The sensitivity of the oscillator can be adjusted using smoothing factor in the Sᴍᴏᴏᴛʜɪɴɢ input box. To plot the actual Donchian Channels, enable Dɪsᴘʟᴀʏ Dᴏɴᴄʜɪᴀɴ Cʜᴀɴɴᴇʟs and to plot the Donchian Channels Breakout Signals, enable Sʜᴏᴡ DC Bʀᴇᴀᴋᴏᴜᴛ Sɪɢɴᴀʟs, with 𝐃𝐢𝐬𝐩𝐥𝐚𝐲 𝐈𝐧𝐝𝐢𝐜𝐚𝐭𝐨𝐫 𝐏𝐥𝐨𝐭 (𝐝𝐢𝐬𝐚𝐛𝐥𝐞𝐬 𝐓𝐫𝐚𝐜𝐤𝐞𝐫/𝐒𝐜𝐨𝐫𝐞𝐜𝐚𝐫𝐝) enabled.
Note: Using smoothing factor more than 1 doesn't reflect the actual Donchian Channels Mean line and also impacts the Tracker block colours.
Net Volume and Heikin Ashi Trend
-------------------------------------------------------
Net Volume and Heikin Ashi Trend can be tracked and plotted for up to 10 symbols in addition to the chart symbol, but both Net Volume and Heikin Ashi Trend are not included in the Visual Scorecard. Since the colour of the Net Volume depends on candle being bullish or bearish, it can help the user visualize if the current candle close of the symbol tracked is above or below the symbols's candle open.
Note: Bar Replay doesn't update the bar by bar indicator plot for historic bars for symbols other than the chart symbol. However, the Indicator Plot is perfectly usable for the realtime bar as data updates for both the Trackers and the Scorecard in realtime.
===================================================================================================================
𝗩𝗶𝘀𝘂𝗮𝗹 𝗦𝗰𝗼𝗿𝗲𝗰𝗮𝗿𝗱
=================
Visual Scorecard plots a green Bull or a red Bear Score colour plot for each Indicator from RSI to Donchian Channels Oscillator against every symbol tracked for up to 5 symbols max (First 5 symbols under 𝗧𝗿𝗮𝗰𝗸𝗲𝗿 𝗣𝗹𝗼𝘁𝘀 section). The gap between the scores can be adjusted using gap factor under Gᴀᴘ Fᴀᴄᴛᴏʀ ʙᴇᴛᴡᴇᴇɴ Sᴄᴏʀᴇs dropdown.
Visual Scorecard scoring method
----------------------------------------------------
RSI > 50 - 🟢
RSI < 50 - 🔴
Stoch > 50 - 🟢
Stoch < 50 - 🔴
CCI > 0 - 🟢
CCI < 0 - 🔴
Close price above MA plot - 🟢
Close price below MA plot - 🔴
MACD > 0 - 🟢
MACD < 0 - 🔴
Bollinger Bands %B > 50 - 🟢
Bollinger Bands %B < 50 - 🔴
Ichimoku Bullish Kumo Trend - 🟢
Ichimoku Bearish Kumo Trend - 🔴
Donchian Channels Oscillator > 0 (or close price above DC Mean Line) - 🟢
Donchian Channels Oscillator < 0 (or close price below DC Mean Line) - 🔴
Note: Bar Replay doesn't update the bar by bar scores/tracker data for historic bars for symbols other than the chart symbol. However, the Scorecard is perfectly usable for the realtime bar as data updates for both the Trackers and the Scorecard in realtime.
===================================================================================================================
𝗠𝘂𝗹𝘁𝗶 𝗦𝘆𝗺𝗯𝗼𝗹 𝗧𝗿𝗮𝗰𝗸𝗲𝗿𝘀/𝗟𝗮𝗯𝗲𝗹𝘀
=============================
Multi Symbol Tracker blocks continuously track the real-time indicator data of up to 10 symbols (in addition to the chart symbol) based on the number of Symbol Trackers preferred in the 𝐍𝐮𝐦𝐛𝐞𝐫 𝐨𝐟 𝐒𝐲𝐦𝐛𝐨𝐥 𝐓𝐫𝐚𝐜𝐤𝐞𝐫𝐬 (𝟎-𝟏𝟎) input box under the 𝗧𝗿𝗮𝗰𝗸𝗲𝗿 𝗣𝗹𝗼𝘁𝘀 section, and plots Bull, Bear and Neutral colour coded blocks based on both the indicator selected and settings preferred by the user under the relevant indicator section.
Multi Symbol Tracker Labels also continuously track the real-time indicator data in addition to the last close price (if 𝐒𝐡𝐨𝐰 𝐏𝐫𝐢𝐜𝐞 is enabled under 𝗧𝗿𝗮𝗰𝗸𝗲𝗿 𝗣𝗹𝗼𝘁𝘀 section), which helps user see the real-time changes in the indicator values and price changes of the symbols tracked.
The Tracker Label colours are exactly the same as the Tracker Block colours and are filtered based on the user preferred bands on the Oscillator values. This is slightly different to the Visual Scorecard Colour coding as the range between the user preferred bands is colour coded in a neutral colour, whereas the Scorecard uses only Bull and Bear Colours as explained in the 𝗩𝗶𝘀𝘂𝗮𝗹 𝗦𝗰𝗼𝗿𝗲𝗰𝗮𝗿𝗱 heading above. For example, if the user prefers RSI upper band of 60 and lower band of 40, the range between the values of 40 and 60 will be colour coded in neutral colour which can be changed from the 𝗨𝘀𝗲𝗳𝘂𝗹 𝗘𝘅𝘁𝗿𝗮𝘀 section of the indicator settings.
Note 1: Default settings are based on the Oscillator mid values and hence the Tracker Blocks match with the Visual Scorecard colour codes. Using Upper and Lower bands for oscillators help spot the oversold and overbought zones and also helps spot breakout threshold based on Indicator values specified by the user. Example chart with visual depiction below using RSI.
Note 2: Bar Replay doesn't update the bar by bar scores/tracker data for historic bars for symbols other than the chart symbol. However, the Tracker blocks/labels are perfectly usable for the realtime bar as data updates for both the Trackers and the Scorecard in realtime.
===================================================================================================================
Frequently Asked Questions
========================
Q: When I load the ™TradeChartist Tracker, why are the values in the labels blurred sometimes?
A: This happens occasionally as shown in the chart below, when the script is loaded for the first time or when a different setting is used.
To resolve this, just hide and unhide the script using the 👁 next to the Indicator title. If it is not visible, just hover the mouse/crosshair over the Indicator Title and it will be visible.
Q: Why does the indicator plot, tracker blocks and labels of Symbols being tracked, not update when I use Bar Replay?
A: As explained in the relevant sections above, historic data for bars and indicators other than chart symbol doesn't update on bar replay. But the chart symbol data does update for every bar on bar replay. This doesn't affect the real-time values and block colours for the symbols tracked.
Q: Can I track real-time values of a currently trading symbol when I'm on a symbol chart that is inactive? For example, can I see labels with real-time BTC values on a Sunday when I'm on a SPX chart when its not in session?
A: Simple answer is no. This is because, the plots are based on bar times of the chart and the symbols are tracked based on the bar time. So if the SPX session ended on Friday, the last known value of the BTC labels will be from Friday and hence it is always recommended to track symbols from a symbol chart that is in session.
Q: Does ™TradeChartist Tracker repaint?
A: This indicator doesn't repaint but it is not recommended to trade a different symbol from the chart based on the real-time data alone without checking if the current symbol chart is in session as inactive price chart will not have updated data on symbols tracked. Also, bar replay doesn't work on data pulled from external symbol data than the chart symbol, but signals confirmed at candle close and confirmed by Tracker blocks with appropriate colour code will be in agreement with the respective indicator and can be double checked for building trust and confidence on the indicator.
Q: Can ™TradeChartist Tracker be connected to other indicators as external source?
A: Yes. ™TradeChartist Tracker can be connected to another script and there are several use cases in doing so. A couple of examples are shown below.
1. ™TradeChartist Tracker's Bollinger Bands %B 𝗜𝗻𝗱𝗶𝗰𝗮𝘁𝗼𝗿 𝗣𝗹𝗼𝘁 connected to ™TradeChartist Plotter to plot Divergences on the 4hr XAU-USD main price chart.
2. ™TradeChartist Tracker's 𝐁𝐫𝐞𝐚𝐤𝐨𝐮𝐭 𝐓𝐫𝐞𝐧𝐝 𝐈𝐝𝐞𝐧𝐭𝐢𝐟𝐢𝐞𝐫 connected to ™TradeChartist Plug and Trade as Oscillatory Signal with 0/0 to generate trade signals with Targets and performance information on trades.
More Example Charts
==================
===================================================================================================================
Best Practice: Test with different settings first using Paper Trades before trading with real money
===================================================================================================================
This is not a free to use indicator. Get in touch with me (PM me directly if you would like trial access to test the indicator)
Premium Scripts - Trial access and Information
Trial access offered on all Premium scripts.
PM me directly to request trial access to the scripts or for more information.
===================================================================================================================
Skrip jemputan sahaja
Hanya pengguna disahkan oleh penulis boleh mengakses skrip ini. Anda perlu memohon dan mendapatkan kebenaran untuk menggunakannya. Keizinan selalunya diberikan selepas pembayaran. Untuk lebih butiran, ikuti arahan penulis di bawah atau hubungi TradeChartist secara terus.
TradingView TIDAK menyarankan pembayaran atau penggunaan skrip kecuali anda mempercayai sepenuhnya penulis dan memahami bagaimana ia berfungsi. Anda juga boleh menjumpai alternatif sumber terbuka dan percuma yang lain di dalam skrip komuniti kami.
Arahan penulis
Telegram - @Trade_Chartist
Free Scripts - bit.ly/Free-Scripts
Penafian
Skrip jemputan sahaja
Hanya pengguna disahkan oleh penulis boleh mengakses skrip ini. Anda perlu memohon dan mendapatkan kebenaran untuk menggunakannya. Keizinan selalunya diberikan selepas pembayaran. Untuk lebih butiran, ikuti arahan penulis di bawah atau hubungi TradeChartist secara terus.
TradingView TIDAK menyarankan pembayaran atau penggunaan skrip kecuali anda mempercayai sepenuhnya penulis dan memahami bagaimana ia berfungsi. Anda juga boleh menjumpai alternatif sumber terbuka dan percuma yang lain di dalam skrip komuniti kami.
Arahan penulis
Telegram - @Trade_Chartist
Free Scripts - bit.ly/Free-Scripts