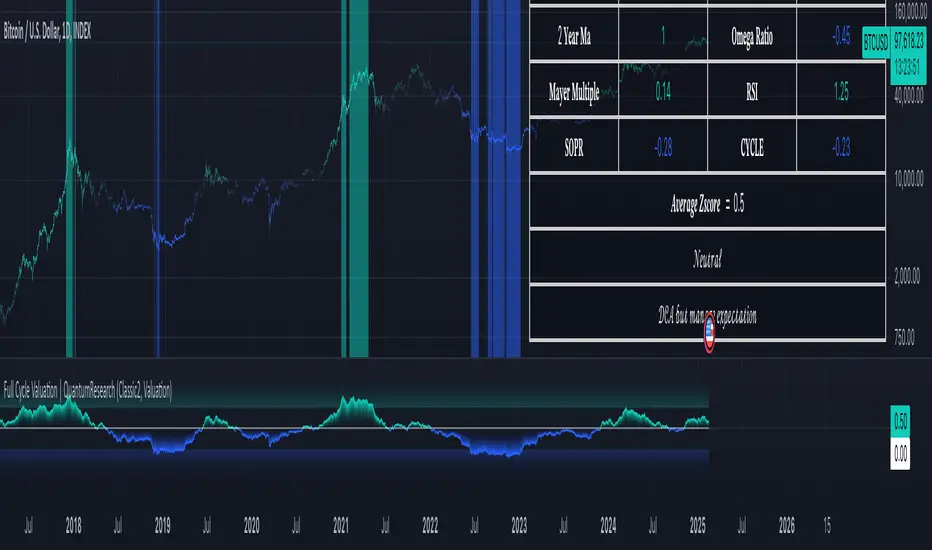
Full Cycle Valuation | QuantumResearch
The Full Cycle Valuation indicator is an advanced on-chain valuation model that synthesizes multiple fundamental Bitcoin metrics into a single, normalized score.
By leveraging Power Law Corridor, Pi Cycle Top, Crosby Ratio, MVRV Z-Score, SOPR Z-Score, NUPL Z-Score, BAERM, and other key valuation signals, this tool provides traders and investors with an intuitive way to assess Bitcoin’s market cycle positioning and identify potential overbought or undervalued conditions. 🚀📊
1. Overview
This indicator helps users:
Identify Market Cycles – Uses a blend of statistical and fundamental models to determine whether Bitcoin is undervalued or overvalued.🔄
Normalize On-Chain & Valuation Metrics – Standardizes multiple valuation indicators through Z-score transformation for clearer insights📉📈
Assess Risk & Reward – Generates an Average Valuation Z-score, offering a high-level overview of current market positioning. ⚖️
Customize Visual Preferences – Dynamic color-coded signals, background fills, and table-based valuation metrics enhance usability. 🎨
2. How It Works
A. Power Law Corridor
The Power Law Model provides a long-term price corridor for Bitcoin based on a logarithmic regression formula. 🔢
The indicator evaluates where the current price sits relative to the Power Law Support & Resistance levels. 📊
Normalized Z-score Calculation: A standardized metric indicating overvaluation or undervaluation. 🎯
B. Pi Cycle Top
Uses the 111-day and 350-day moving averages to identify cyclical market peaks. 🔺
Generates a Z-score that measures deviation from historical overbought conditions. ⚠️
C. Crosby Ratio
Measures market momentum by analyzing Heikin-Ashi candle trends and ATR-based volatility. 📊
Provides a weekly trend strength score that is normalized into a Z-score. 📈
D. MVRV Z-Score
Compares Bitcoin's Market Cap to Realized Cap to assess whether price is above or below fair value. 💰
The higher the MVRV Z-score, the more overvalued Bitcoin is; lower scores indicate undervaluation. 🔻
E. SOPR Z-Score
Spent Output Profit Ratio (SOPR) measures profit-taking behavior in the market. 💵
SOPR is smoothed and standardized to filter out noise and highlight macro trends. 📊
F. NUPL Z-Score
Net Unrealized Profit/Loss (NUPL) calculates the proportion of coins held in profit versus loss. 📉📈
High Z-score values indicate speculative euphoria, while low values suggest capitulation. ⚠️
G. BAERM (Bitcoin AR Model)
BAERM is a statistical model that incorporates Bitcoin's supply, halvings, and historical growth trends to estimate fair value. 📉
This model is adjusted with a damping function to remove excess noise. 🎛️
H. Composite Full Cycle Z-Score
The indicator calculates a weighted average Z-score across all valuation models to generate a final Full Cycle Valuation Score. 📊
The score is used to define five distinct market states:
Very Undervalued (-3 to -2 Z-score): Ideal accumulation zone. 🟢
Undervalued (-2 to -1.5 Z-score): Accumulate Bitcoin at a discount. 🔵
Neutral (-1.5 to +1.5 Z-score): Fair market conditions. ⚪
Overheated (+1.5 to +2 Z-score): Potential distribution phase. 🟠
Very Overheated (>2 Z-score): High risk of market tops. 🔴
3. Visual Representation
This indicator offers multiple dynamic visual elements to improve clarity and ease of use:
Color-Coded Background Fill
Green Background – Indicates undervalued market conditions (Accumulation). 🟢
Blue Background – Signals overheated conditions (Distribution). 🔵
Table Display for Z-Scores
Displays each individual valuation model’s Z-score in a compact, color-coded format. 📊
The final average Z-score is highlighted, along with a corresponding market action recommendation. 🎯
4. Customization & Parameters
Traders and analysts can fine-tune the Full Cycle Valuation indicator to match their specific strategies:
On-Chain Valuation Metrics MVRV, SOPR, and NUPL Z-score lengths can be adjusted for different market perspectives.
Market Cycle Models Power Law Corridor: Adjustable regression parameters to modify long-term projections.
Pi Cycle & Crosby Ratio: Customizable smoothing lengths.
Threshold Adjustments Modify overvaluation and undervaluation thresholds to fine-tune signal sensitivity.
Visual Settings
Valuation Mode: Allows traders to switch between default mode and valuation-focused color themes. 🎨
5. Trading Applications
This indicator is not just for trading—it serves as a powerful macro analysis tool:
Long-Term Investing – Helps Bitcoin investors identify key accumulation and distribution phases. 📈
Market Timing – Guides traders in recognizing overbought and oversold conditions based on fundamental valuation. ⏳
Risk Management – Provides a systematic way to assess whether Bitcoin is fundamentally cheap or expensive. ⚠️
Cyclical Trend Analysis – Helps long-term investors compare past market cycles and spot repeating patterns. 🔄
6. Final Thoughts
The Full Cycle Valuation Indicator is a comprehensive macro valuation tool that combines multiple on-chain, statistical, and fundamental models into one easy-to-interpret score.
Whether you are a long-term investor looking to time Bitcoin cycles or a trader searching for additional confluence, this tool offers invaluable insights.
Important Disclaimer: No indicator can predict future price action with certainty. Always perform additional research and use proper risk management when making investment decisions. ⚠️📊
Skrip jemputan sahaja
Hanya pengguna disahkan oleh penulis boleh mengakses skrip ini. Anda perlu memohon dan mendapatkan kebenaran untuk menggunakannya. Keizinan selalunya diberikan selepas pembayaran. Untuk lebih butiran, ikuti arahan penulis di bawah atau hubungi QuantumResearch secara terus.
TradingView TIDAK menyarankan pembayaran atau penggunaan skrip kecuali anda mempercayai sepenuhnya penulis dan memahami bagaimana ia berfungsi. Anda juga boleh menjumpai alternatif sumber terbuka dan percuma yang lain di dalam skrip komuniti kami.
Arahan penulis
whop.com/quantum-whop/
⚒️ Get access to our toolbox here for free:
quantumresearchportfolio.carrd.co
All tools and content provided are for informational and educational purposes only.
Penafian
Skrip jemputan sahaja
Hanya pengguna disahkan oleh penulis boleh mengakses skrip ini. Anda perlu memohon dan mendapatkan kebenaran untuk menggunakannya. Keizinan selalunya diberikan selepas pembayaran. Untuk lebih butiran, ikuti arahan penulis di bawah atau hubungi QuantumResearch secara terus.
TradingView TIDAK menyarankan pembayaran atau penggunaan skrip kecuali anda mempercayai sepenuhnya penulis dan memahami bagaimana ia berfungsi. Anda juga boleh menjumpai alternatif sumber terbuka dan percuma yang lain di dalam skrip komuniti kami.
Arahan penulis
whop.com/quantum-whop/
⚒️ Get access to our toolbox here for free:
quantumresearchportfolio.carrd.co
All tools and content provided are for informational and educational purposes only.