Bull-Bear Pressure
Uniqueness
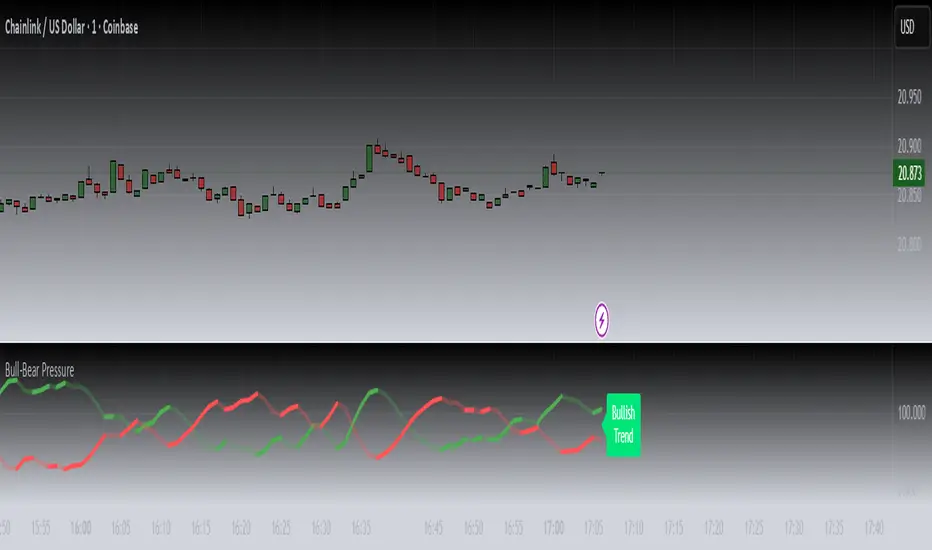
Bull-Bear Pressure measures the live tug-of-war between bullish and bearish momentum by transforming internal engine data into a visual gauge of market pressure.
How It Works
The indicator processes dual data feeds — one representing bullish pressure and the other bearish pressure. These values update in real time showing how pressure dynamics are currently distributed and highlighting areas where momentum dynamics may be adjusting.
Usefulness
By monitoring pressure dynamics, traders gain context on whether moves are supported by strong participation or fading momentum. It adds depth to directional bias especially when viewing multiple timeframe charts side by side.
How to Use It
Overlay Bull-Bear Pressure on your chart and compare shifts in bullish vs bearish strength. Use it underneath multi-timeframe or forecast-style indicators for added context.
Disclaimer
This indicator produces visual and informational outputs only. It does not generate trade signals, entry/exit rules, or backtestable strategies. The tool is intended purely as an educational resource to help users interpret market behavior. It does not constitute financial advice, and past performance does not guarantee future results. Trading involves risk, and you may lose some or all of your investment.
Release Notes:
v1.0 (Initial Release)
Skrip jemputan sahaja
Hanya pengguna disahkan oleh penulis boleh mengakses skrip ini. Anda perlu memohon dan mendapatkan kebenaran untuk menggunakannya. Keizinan selalunya diberikan selepas pembayaran. Untuk lebih butiran, ikuti arahan penulis di bawah atau hubungi Predator-Trading-Systems secara terus.
TradingView TIDAK menyarankan pembayaran atau penggunaan skrip kecuali anda mempercayai sepenuhnya penulis dan memahami bagaimana ia berfungsi. Anda juga boleh menjumpai alternatif sumber terbuka dan percuma yang lain di dalam skrip komuniti kami.
Arahan penulis
Penafian
Skrip jemputan sahaja
Hanya pengguna disahkan oleh penulis boleh mengakses skrip ini. Anda perlu memohon dan mendapatkan kebenaran untuk menggunakannya. Keizinan selalunya diberikan selepas pembayaran. Untuk lebih butiran, ikuti arahan penulis di bawah atau hubungi Predator-Trading-Systems secara terus.
TradingView TIDAK menyarankan pembayaran atau penggunaan skrip kecuali anda mempercayai sepenuhnya penulis dan memahami bagaimana ia berfungsi. Anda juga boleh menjumpai alternatif sumber terbuka dan percuma yang lain di dalam skrip komuniti kami.