PROTECTED SOURCE SCRIPT
DC History & Daily Cross Count
Okay, here is a technical document for the Pine Script indicator we developed. This can be used as a guide or description when publishing the script on TradingView or elsewhere.
Technical Document: SMA Cross Signals & Static DC History (Death Cross)
Version: 1.0
Date: April 14, 2025
Indicator Name: Specific Static DC History + Live Signals
Pine Script Version: 5
1. Overview
This TradingView indicator is designed to provide traders with visual signals for Simple Moving Average (SMA) crossovers, specifically focusing on the "Death Cross", while also presenting relevant historical context via a static data table and a real-time daily cross counter.
It combines several features:
Plotting of a fast and a slow Simple Moving Average (SMA).
Visual identification and marking of "Death Cross" events (Fast SMA crossing below Slow SMA) directly on the price chart.
A customizable table displaying static, pre-defined historical performance data of the S&P 500 following specific Death Crosses that occurred between 2016 and 2022.
An optional label that counts the total number of SMA crosses (both Golden Crosses and Death Crosses) occurring during the current trading day/session, including extended hours if enabled by the user on their chart.
2. Features
Customizable SMA Lengths: User-defined periods for both the Fast (default 50) and Slow (default 200) SMAs.
Death Cross Signals: Clear visual markers (red triangles above the bar and optional background shading) when the Fast SMA closes below the Slow SMA.
Optional SMA Plotting: Ability to show or hide the SMA lines themselves.
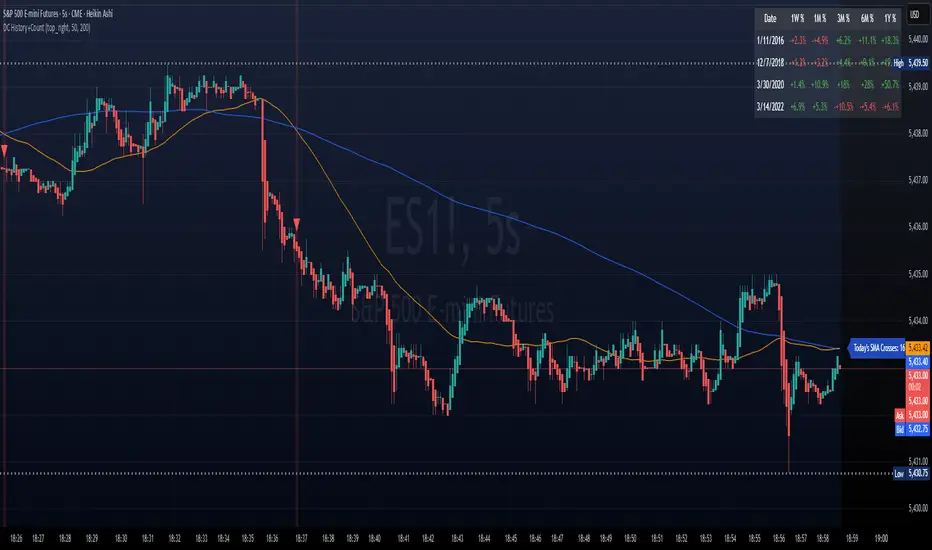
Static Historical Performance Table: Displays fixed historical return data (1 Week, 1 Month, 3 Months, 6 Months, 1 Year) following specific S&P 500 Death Crosses that occurred on 1/11/2016, 12/7/2018, 3/30/2020, and 3/14/2022. Note: This data is static and does not change based on the current chart.
Customizable Table Position: User can select the on-screen corner for the data table.
Daily SMA Cross Counter: Optionally displays a label showing the cumulative number of times the Fast SMA has crossed above (Golden Cross) or below (Death Cross) the Slow SMA during the current trading day/session.
Extended Hours Compatibility: The Daily Cross Counter includes crosses from pre-market and after-hours sessions if the user has "Extended Trading Hours" enabled on their TradingView chart settings.
3. Technical Explanation
SMA Calculation: The script uses the built-in ta.sma(source, length) function, calculating the Simple Moving Average based on the close price of each bar for the user-defined fastLen and slowLen.
Death Cross Detection: A Death Cross is detected using ta.crossunder(fastMA, slowMA). This function returns true on the first bar where the value of fastMA is less than the value of slowMA, after previously being greater than or equal to it. The comparison is based on the calculated SMA values at the close of each bar.
Golden Cross Detection: Similarly, ta.crossover(fastMA, slowMA) is used to detect Golden Crosses for the daily counter.
Visual Signals: The plotshape() function draws a red triangle above the bar where deathCross is true. The bgcolor() function applies a transparent red background to the bar where deathCross is true.
Static Table Data: The historical performance data for the 4 specified dates (Jan 2016 - Mar 2022) is hardcoded into array variables within the script. This data was derived from a prior analysis (based on the initially provided image, source likely Dow Jones Market Data or similar) and is not calculated dynamically from the chart. The script iterates through these arrays and populates a table object on the last bar.
Daily Cross Counter:
A var int dailyCrossCount variable holds the count, ensuring persistence across bars within a day.
ta.change(time("D")) detects the start of a new daily session based on the chart's symbol and session settings. When true, the dailyCrossCount is reset to 0.
On each bar, if either deathCross or goldenCross is true, the dailyCrossCount is incremented.
A label object displays the dailyCrossCount and is updated on the last bar (barstate.islast).
Extended Hours Inclusion: The script inherently uses the data series provided by the chart. If the chart is configured to include Extended Trading Hours (ETH), the close prices used for SMA calculations will reflect ETH data, and crosses occurring during ETH will be detected and counted.
4. Settings (Inputs)
Show Static Data Table (2016-2022) (Checkbox): Toggles the visibility of the table containing the fixed historical performance data. (Default: On)
Table Position (Dropdown): Selects the corner or side of the chart where the static data table will be displayed. (Default: top_right)
Plot 50/200 SMAs (Checkbox): Toggles the visibility of the Fast and Slow SMA lines on the chart. (Default: On)
Fast MA Length (Integer Input): Sets the lookback period for the Fast Simple Moving Average. (Default: 50)
Slow MA Length (Integer Input): Sets the lookback period for the Slow Simple Moving Average. (Default: 200)
Show Daily Cross Count (Checkbox): Toggles the visibility of the label displaying the number of SMA crosses detected during the current day's session. (Default: On)
5. How to Use / Interpretation
Apply the indicator to your desired chart (e.g., SPY, QQQ, /ES).
Use the plotted SMA lines (if enabled) and the red triangle/background signals to identify potential trend changes indicated by Death Crosses based on your chosen MA lengths. Remember that these are lagging indicators.
Refer to the static data table for historical context only. It shows how the S&P 500 performed following specific Death Crosses between 2016 and 2022. This data is fixed and does not predict future performance.
Use the "Today's SMA Crosses" label (if enabled) to gauge the frequency of interaction between the chosen SMAs during the current session. A higher number might indicate choppier conditions or potential shifts on the chart's timeframe.
Important: For the Daily Cross Counter to reflect pre-market/after-hours activity, ensure "Extended Trading Hours" (ETH) is enabled in your TradingView chart settings.
Be aware that the number of crosses detected by the script (based on bar closes) may differ from visual interpretations of lines touching intraday, especially on lower timeframes.
6. Limitations
Static Table Data: The performance data in the table is fixed to the 4 provided historical instances (2016-2022) and is not calculated dynamically or updated. It serves only as a historical reference point.
Lagging Indicators: Moving Averages and their crosses are lagging indicators and may not signal trend changes precisely at tops or bottoms.
Cross Calculation: Crosses are based on the closing price of each bar. Intraday price movements briefly piercing an SMA may not register as a confirmed cross.
Daily Counter Definition: The definition of "Today" depends on the chart's session timing, which might not align perfectly with a calendar day.
Whipsaws: On lower timeframes or during volatile periods, MA crosses can generate frequent signals (whipsaws) which may be less reliable.
7. Disclaimer
This indicator is provided for informational and educational purposes only. It does not constitute financial advice or a recommendation to buy or sell any security. Trading involves significant risk, and past performance (including the historical data presented in the table) is not indicative of future results. Always conduct your own thorough research and consult with a qualified financial advisor before making any trading decisions.
Technical Document: SMA Cross Signals & Static DC History (Death Cross)
Version: 1.0
Date: April 14, 2025
Indicator Name: Specific Static DC History + Live Signals
Pine Script Version: 5
1. Overview
This TradingView indicator is designed to provide traders with visual signals for Simple Moving Average (SMA) crossovers, specifically focusing on the "Death Cross", while also presenting relevant historical context via a static data table and a real-time daily cross counter.
It combines several features:
Plotting of a fast and a slow Simple Moving Average (SMA).
Visual identification and marking of "Death Cross" events (Fast SMA crossing below Slow SMA) directly on the price chart.
A customizable table displaying static, pre-defined historical performance data of the S&P 500 following specific Death Crosses that occurred between 2016 and 2022.
An optional label that counts the total number of SMA crosses (both Golden Crosses and Death Crosses) occurring during the current trading day/session, including extended hours if enabled by the user on their chart.
2. Features
Customizable SMA Lengths: User-defined periods for both the Fast (default 50) and Slow (default 200) SMAs.
Death Cross Signals: Clear visual markers (red triangles above the bar and optional background shading) when the Fast SMA closes below the Slow SMA.
Optional SMA Plotting: Ability to show or hide the SMA lines themselves.
Static Historical Performance Table: Displays fixed historical return data (1 Week, 1 Month, 3 Months, 6 Months, 1 Year) following specific S&P 500 Death Crosses that occurred on 1/11/2016, 12/7/2018, 3/30/2020, and 3/14/2022. Note: This data is static and does not change based on the current chart.
Customizable Table Position: User can select the on-screen corner for the data table.
Daily SMA Cross Counter: Optionally displays a label showing the cumulative number of times the Fast SMA has crossed above (Golden Cross) or below (Death Cross) the Slow SMA during the current trading day/session.
Extended Hours Compatibility: The Daily Cross Counter includes crosses from pre-market and after-hours sessions if the user has "Extended Trading Hours" enabled on their TradingView chart settings.
3. Technical Explanation
SMA Calculation: The script uses the built-in ta.sma(source, length) function, calculating the Simple Moving Average based on the close price of each bar for the user-defined fastLen and slowLen.
Death Cross Detection: A Death Cross is detected using ta.crossunder(fastMA, slowMA). This function returns true on the first bar where the value of fastMA is less than the value of slowMA, after previously being greater than or equal to it. The comparison is based on the calculated SMA values at the close of each bar.
Golden Cross Detection: Similarly, ta.crossover(fastMA, slowMA) is used to detect Golden Crosses for the daily counter.
Visual Signals: The plotshape() function draws a red triangle above the bar where deathCross is true. The bgcolor() function applies a transparent red background to the bar where deathCross is true.
Static Table Data: The historical performance data for the 4 specified dates (Jan 2016 - Mar 2022) is hardcoded into array variables within the script. This data was derived from a prior analysis (based on the initially provided image, source likely Dow Jones Market Data or similar) and is not calculated dynamically from the chart. The script iterates through these arrays and populates a table object on the last bar.
Daily Cross Counter:
A var int dailyCrossCount variable holds the count, ensuring persistence across bars within a day.
ta.change(time("D")) detects the start of a new daily session based on the chart's symbol and session settings. When true, the dailyCrossCount is reset to 0.
On each bar, if either deathCross or goldenCross is true, the dailyCrossCount is incremented.
A label object displays the dailyCrossCount and is updated on the last bar (barstate.islast).
Extended Hours Inclusion: The script inherently uses the data series provided by the chart. If the chart is configured to include Extended Trading Hours (ETH), the close prices used for SMA calculations will reflect ETH data, and crosses occurring during ETH will be detected and counted.
4. Settings (Inputs)
Show Static Data Table (2016-2022) (Checkbox): Toggles the visibility of the table containing the fixed historical performance data. (Default: On)
Table Position (Dropdown): Selects the corner or side of the chart where the static data table will be displayed. (Default: top_right)
Plot 50/200 SMAs (Checkbox): Toggles the visibility of the Fast and Slow SMA lines on the chart. (Default: On)
Fast MA Length (Integer Input): Sets the lookback period for the Fast Simple Moving Average. (Default: 50)
Slow MA Length (Integer Input): Sets the lookback period for the Slow Simple Moving Average. (Default: 200)
Show Daily Cross Count (Checkbox): Toggles the visibility of the label displaying the number of SMA crosses detected during the current day's session. (Default: On)
5. How to Use / Interpretation
Apply the indicator to your desired chart (e.g., SPY, QQQ, /ES).
Use the plotted SMA lines (if enabled) and the red triangle/background signals to identify potential trend changes indicated by Death Crosses based on your chosen MA lengths. Remember that these are lagging indicators.
Refer to the static data table for historical context only. It shows how the S&P 500 performed following specific Death Crosses between 2016 and 2022. This data is fixed and does not predict future performance.
Use the "Today's SMA Crosses" label (if enabled) to gauge the frequency of interaction between the chosen SMAs during the current session. A higher number might indicate choppier conditions or potential shifts on the chart's timeframe.
Important: For the Daily Cross Counter to reflect pre-market/after-hours activity, ensure "Extended Trading Hours" (ETH) is enabled in your TradingView chart settings.
Be aware that the number of crosses detected by the script (based on bar closes) may differ from visual interpretations of lines touching intraday, especially on lower timeframes.
6. Limitations
Static Table Data: The performance data in the table is fixed to the 4 provided historical instances (2016-2022) and is not calculated dynamically or updated. It serves only as a historical reference point.
Lagging Indicators: Moving Averages and their crosses are lagging indicators and may not signal trend changes precisely at tops or bottoms.
Cross Calculation: Crosses are based on the closing price of each bar. Intraday price movements briefly piercing an SMA may not register as a confirmed cross.
Daily Counter Definition: The definition of "Today" depends on the chart's session timing, which might not align perfectly with a calendar day.
Whipsaws: On lower timeframes or during volatile periods, MA crosses can generate frequent signals (whipsaws) which may be less reliable.
7. Disclaimer
This indicator is provided for informational and educational purposes only. It does not constitute financial advice or a recommendation to buy or sell any security. Trading involves significant risk, and past performance (including the historical data presented in the table) is not indicative of future results. Always conduct your own thorough research and consult with a qualified financial advisor before making any trading decisions.
Skrip dilindungi
Skrip ini diterbitkan sebagai sumber tertutup. Akan tetapi, anda boleh menggunakannya secara bebas dan tanpa apa-apa had – ketahui lebih di sini.
Penafian
Maklumat dan penerbitan adalah tidak bertujuan, dan tidak membentuk, nasihat atau cadangan kewangan, pelaburan, dagangan atau jenis lain yang diberikan atau disahkan oleh TradingView. Baca lebih dalam Terma Penggunaan.