OPEN-SOURCE SCRIPT
Telah dikemas kini [blackcat] L2 Ehlers Empirical Mode Trader
Circumstance Remarks: Because of my carelessness, the script of the same name that I posted before was banned and hidden because the description contained content that violated the TradingView House Rule. After communicating with the MOD, I corrected the description and obtained permission to publish it again. I hereby declare. Sorry for the inconvenience!
Level: 2
Background
John F. Ehlers introuced Empirical Mode Trader Indicator in Mar, 2010.
Function
In his article “Empirical Mode Decomposition,” John Ehlers and Ric Way suggest using methods based on bandpass filtering to distinguish trending from cycling markets. The article’s trading suggestions were used to create the Empirical Mode strategy given here for pine v4 script. If the strategy determines that the marke is in trending mode, then the strategy is allowed to trade with the trend — either long, in uptrends, or short, in downtrends. If the indicator determines that the market is in cycling mode, then the strategy allows trading cycle extremes, using Bollinger bands to trigger entries. You can do this by Choosing either cycle or trend mode at inputs.
Key Signal
Trend ---> Trend signal
FracAvgPeak ---> Upper band signal
FracAvgValley ---> Lower band signal
Pros and Cons
100% John F. Ehlers definition translation, even variable names are the same. This help readers who would like to use pine to read his book.
Remarks
The 75th script for Blackcat1402 John F. Ehlers Week publication.
Readme
In real life, I am a prolific inventor. I have successfully applied for more than 60 international and regional patents in the past 12 years. But in the past two years or so, I have tried to transfer my creativity to the development of trading strategies. Tradingview is the ideal platform for me. I am selecting and contributing some of the hundreds of scripts to publish in Tradingview community. Welcome everyone to interact with me to discuss these interesting pine scripts.
The scripts posted are categorized into 5 levels according to my efforts or manhours put into these works.
Level 1 : interesting script snippets or distinctive improvement from classic indicators or strategy. Level 1 scripts can usually appear in more complex indicators as a function module or element.
Level 2 : composite indicator/strategy. By selecting or combining several independent or dependent functions or sub indicators in proper way, the composite script exhibits a resonance phenomenon which can filter out noise or fake trading signal to enhance trading confidence level.
Level 3 : comprehensive indicator/strategy. They are simple trading systems based on my strategies. They are commonly containing several or all of entry signal, close signal, stop loss, take profit, re-entry, risk management, and position sizing techniques. Even some interesting fundamental and mass psychological aspects are incorporated.
Level 4 : script snippets or functions that do not disclose source code. Interesting element that can reveal market laws and work as raw material for indicators and strategies. If you find Level 1~2 scripts are helpful, Level 4 is a private version that took me far more efforts to develop.
Level 5 : indicator/strategy that do not disclose source code. private version of Level 3 script with my accumulated script processing skills or a large number of custom functions. I had a private function library built in past two years. Level 5 scripts use many of them to achieve private trading strategy.
Nota Keluaran
OVERVIEW The L2 Ehlers Empirical Mode Trader is an advanced technical analysis tool that combines Empirical Mode Decomposition with cycle-based trading strategies. It offers two distinct trading modes: Trend and Cycle, providing comprehensive market insights and trading signals.FEATURES
• Dual trading modes: Trend and Cycle analysis
• Advanced Empirical Mode calculation
• Dynamic signal generation with customizable parameters
• Visual representation of trend lines and trading zones
• Automatic BUY/SELL alerts with labeled markers
• Bollinger Band integration for cycle mode
HOW TO USE
Add the indicator to your chart
Select trading mode: • Trend: Focuses on overall market direction • Cycle: Uses Bollinger Bands for range-bound trading
Configure input parameters: • Price source (default: HL2) • Period length (default: 20) • Delta1 value (default: 0.5) • Fraction multiplier (default: 5) • Trail percentage (default: 3) • Number of deviations (default: 2)
INPUT SETTINGS
• TradingMode: Select between Trend or Cycle analysis
• Price: Choose the price data source
• Period: Set the main calculation period
• Delta1: Controls cycle frequency
• Fraction: Multiplier for average peak/valley
• PctTrail: Percentage for trailing stops
• NumDevs: Standard deviation multiplier for Bollinger Bands
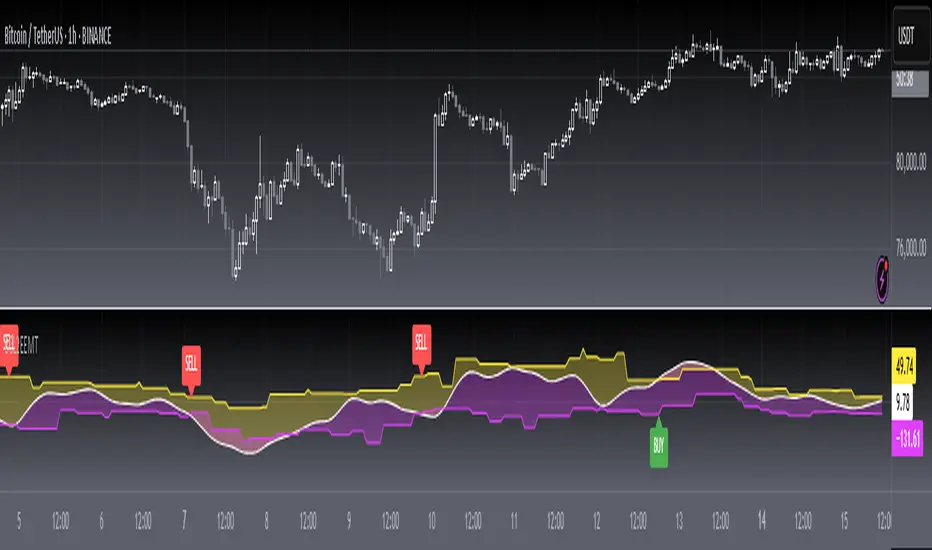
VISUAL INDICATORS
• White line: Main trend line
• Yellow line: Average Peak level
• Fuchsia line: Average Valley level
• Colored fills: Trend zones between lines
• Green labels: Buy signals
• Red labels: Sell signals
LIMITATIONS
• Requires sufficient historical data for accurate calculations
• Performance may vary on low-liquidity assets
• Signal quality depends on proper parameter tuning
Skrip sumber terbuka
Dalam semangat TradingView sebenar, pencipta skrip ini telah menjadikannya sumber terbuka, jadi pedagang boleh menilai dan mengesahkan kefungsiannya. Terima kasih kepada penulis! Walaupuan anda boleh menggunakan secara percuma, ingat bahawa penerbitan semula kod ini tertakluk kepada Peraturan Dalaman.
Avoid losing contact!Don't miss out! The first and most important thing to do is to join my Discord chat now! Click here to start your adventure: discord.com/invite/ZTGpQJq 防止失联,请立即行动,加入本猫聊天群: discord.com/invite/ZTGpQJq
Penafian
Maklumat dan penerbitan adalah tidak bertujuan, dan tidak membentuk, nasihat atau cadangan kewangan, pelaburan, dagangan atau jenis lain yang diberikan atau disahkan oleh TradingView. Baca lebih dalam Terma Penggunaan.