OPEN-SOURCE SCRIPT
Zembala_DMark
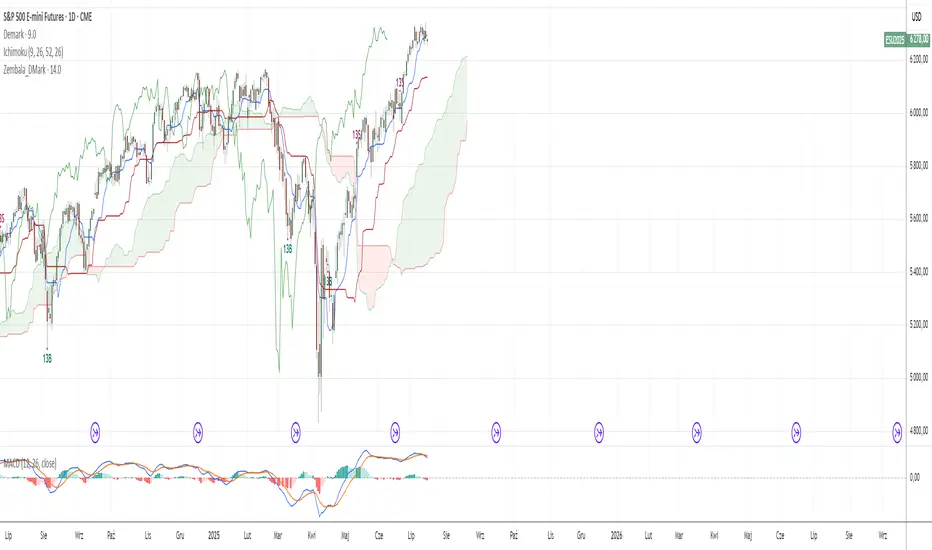
This indicator uses a specific candle-counting technique to identify potential short-term exhaustion points in price action.
It works by comparing the current candle’s closing price to the closing price 9 candles earlier and maintains two separate counts:
Buy Count (13B): Increases when the current close is lower than the close 9 bars ago.
Sell Count (13S): Increases when the current close is higher than the close 9 bars ago.
When either count reaches 13 consecutive conditions, a signal is displayed:
13B (green triangle up) suggests downside exhaustion and a possible short-term rebound.
13S (red triangle down) suggests upside exhaustion and a potential short-term pullback.
These signals are not traditional buy/sell recommendations but instead highlight areas of potential trend fatigue or price extremes. This logic is loosely inspired by bar-counting methods used in certain sequential strategies, but simplified and adapted for general use without reliance on any proprietary methodology.
Skrip sumber terbuka
Dalam semangat sebenar TradingView, pencipta skrip ini telah menjadikannya sumber terbuka supaya pedagang dapat menilai dan mengesahkan kefungsiannya. Terima kasih kepada penulis! Walaupun anda boleh menggunakannya secara percuma, ingat bahawa menerbitkan semula kod ini adalah tertakluk kepada Peraturan Dalaman kami.
Penafian
Maklumat dan penerbitan adalah tidak dimaksudkan untuk menjadi, dan tidak membentuk, nasihat untuk kewangan, pelaburan, perdagangan dan jenis-jenis lain atau cadangan yang dibekalkan atau disahkan oleh TradingView. Baca dengan lebih lanjut di Terma Penggunaan.