OPEN-SOURCE SCRIPT
Anchored Grids ft. Volume
INTRO
The 'Volume Profile' is a great tool, isn’t it? It shows us where volume has accumulated on the chart and helps guide trading decisions. The only catch is that we can’t really choose the levels—it’s all based on where volume happens to cluster. But what if we reversed the logic and measured the volume at the levels we define? That’s exactly what this script does, giving you a fresh way to spot support and resistance :)
OVERVIEW
'Anchored Grids ft. Volume' is a sophisticated technical analysis tool that combines price grid analysis with volume accumulation metrics. This indicator dynamically calculates and displays custom support and resistance levels based on a user-defined timeframe, while simultaneously tracking and visualizing volume accumulation at each specific price level. Unlike traditional volume profile indicators that use complex statistical clustering, this tool provides straightforward volume measurement at predetermined technical levels. It answers a critical question: "How much trading activity occurred near the key price levels I care about?".
HOW DOES THIS INDICATOR WORK?
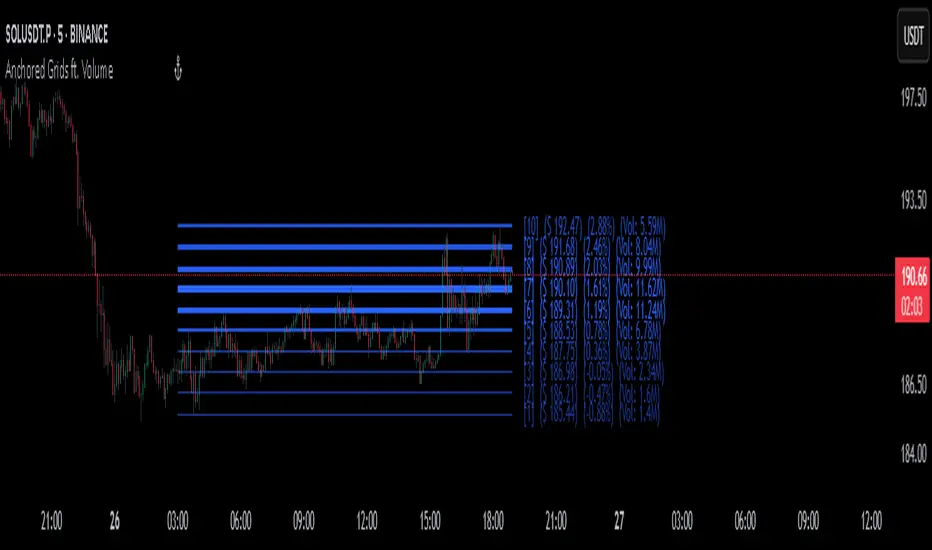
This indicator builds a customizable grid system anchored to the opening price of any user-selected timeframe (hourly, daily, weekly, etc.). From that anchor point, it continuously tracks the highest high and lowest low, then calculates equidistant grid levels within that range. Two calculation modes are available—Arithmetic and Geometric—allowing flexibility in how the levels are distributed.
Once the grid is established, a volume accumulation engine comes into play. For each price bar, the script checks whether the bar’s range intersects with any level’s tolerance zone (default 0.01%). If a touch is detected, that bar’s volume is added to the corresponding level. Over time, this process builds a clear picture of where significant trading activity has clustered.
The visualization system highlights these dynamics by applying a color gradient based on volume intensity and adjusting line thickness proportional to accumulated volume. Each level is also labeled with four key data points:
PARAMETERS
ORIGINALITY
It’s possible to find comprehensive grid-drawing tools among community indicators, but I haven’t come across an example that combines this concept with volume data. More importantly, I wanted to demonstrate how volume accumulation can be generated for any data modeled as an array on the chart by developers.
SUMMARY
In conclusion, the selected timeframe and the number of grids are only used as a reference to determine where the levels are drawn. The true value of this indicator lies in its ability to calculate volume accumulation directly from the chart’s own candles, showing how much trading activity occurred around each level. The result is a hybrid framework that merges structural price analysis with volume distribution, offering traders deeper insights into where markets are likely to react.
NOTE
While powerful, this tool should be used as part of a comprehensive trading strategy rather than as a standalone system. Always combine with risk management principles and market context awareness. I hope it helps everyone. Trade as safely as possible. Best of luck!
The 'Volume Profile' is a great tool, isn’t it? It shows us where volume has accumulated on the chart and helps guide trading decisions. The only catch is that we can’t really choose the levels—it’s all based on where volume happens to cluster. But what if we reversed the logic and measured the volume at the levels we define? That’s exactly what this script does, giving you a fresh way to spot support and resistance :)
OVERVIEW
'Anchored Grids ft. Volume' is a sophisticated technical analysis tool that combines price grid analysis with volume accumulation metrics. This indicator dynamically calculates and displays custom support and resistance levels based on a user-defined timeframe, while simultaneously tracking and visualizing volume accumulation at each specific price level. Unlike traditional volume profile indicators that use complex statistical clustering, this tool provides straightforward volume measurement at predetermined technical levels. It answers a critical question: "How much trading activity occurred near the key price levels I care about?".
HOW DOES THIS INDICATOR WORK?
This indicator builds a customizable grid system anchored to the opening price of any user-selected timeframe (hourly, daily, weekly, etc.). From that anchor point, it continuously tracks the highest high and lowest low, then calculates equidistant grid levels within that range. Two calculation modes are available—Arithmetic and Geometric—allowing flexibility in how the levels are distributed.
Once the grid is established, a volume accumulation engine comes into play. For each price bar, the script checks whether the bar’s range intersects with any level’s tolerance zone (default 0.01%). If a touch is detected, that bar’s volume is added to the corresponding level. Over time, this process builds a clear picture of where significant trading activity has clustered.
The visualization system highlights these dynamics by applying a color gradient based on volume intensity and adjusting line thickness proportional to accumulated volume. Each level is also labeled with four key data points:
- The grid number (in square brackets)
- The price of the level
- The percentage distance between the level and the opening price of the selected timeframe
- The total volume accumulated within the level’s tolerance range
PARAMETERS
- Timeframe: Defines the anchor period for grid calculation. Then, the indicator automatically determines the open, high, and low prices.
- Mode: This option determines how the distance between levels is calculated: Arithmetic (linear) means equal price spacing between levels, while Geometric (logarithmic) means equal percentage spacing between levels.
- Grids: It's the number of levels between high and low.
- Color: Base color for grid lines and labels. When volume data is displayed, lower values are darkened by 50%.
- Show Volume Accumulation: When this parameter is activated, the volume calculation is enabled.
- Tolerance : The Tolerance parameter (default range: 0.01%) defines the price range around each grid level where volume accumulation is registered. It acts as a sensitivity control that determines how close price must be to a level to count trading volume toward that level's accumulation.
ORIGINALITY
It’s possible to find comprehensive grid-drawing tools among community indicators, but I haven’t come across an example that combines this concept with volume data. More importantly, I wanted to demonstrate how volume accumulation can be generated for any data modeled as an array on the chart by developers.
SUMMARY
In conclusion, the selected timeframe and the number of grids are only used as a reference to determine where the levels are drawn. The true value of this indicator lies in its ability to calculate volume accumulation directly from the chart’s own candles, showing how much trading activity occurred around each level. The result is a hybrid framework that merges structural price analysis with volume distribution, offering traders deeper insights into where markets are likely to react.
NOTE
While powerful, this tool should be used as part of a comprehensive trading strategy rather than as a standalone system. Always combine with risk management principles and market context awareness. I hope it helps everyone. Trade as safely as possible. Best of luck!
Skrip sumber terbuka
Dalam semangat TradingView sebenar, pencipta skrip ini telah menjadikannya sumber terbuka, jadi pedagang boleh menilai dan mengesahkan kefungsiannya. Terima kasih kepada penulis! Walaupuan anda boleh menggunakan secara percuma, ingat bahawa penerbitan semula kod ini tertakluk kepada Peraturan Dalaman.
Penafian
Maklumat dan penerbitan adalah tidak bertujuan, dan tidak membentuk, nasihat atau cadangan kewangan, pelaburan, dagangan atau jenis lain yang diberikan atau disahkan oleh TradingView. Baca lebih dalam Terma Penggunaan.