OPEN-SOURCE SCRIPT
Penguin Trend
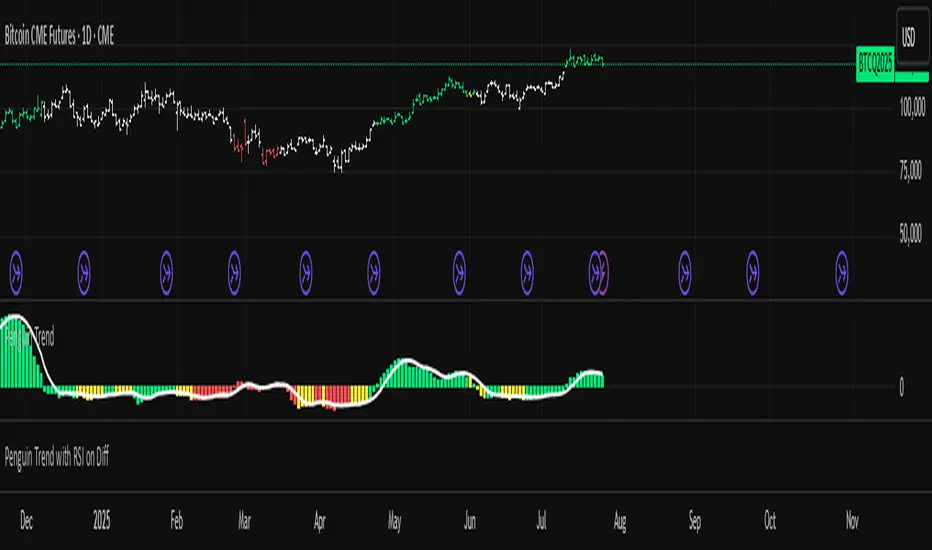
🐧 Penguin Trend [Volatility Squeeze + MACD Filter]
Overview
The "Penguin Trend" indicator is designed to help traders identify potential breakouts after a period of low volatility or consolidation. It combines the concept of a Volatility Squeeze (Bollinger Bands vs. Keltner Channels) with a MACD-based trend filter to provide higher-probability signals.
---
How It Works
The indicator is based on three core components:
1. Volatility Squeeze:
The histogram bars appear only when volatility expands (the Upper BB moves outside the Upper KC). This event is known as a "Squeeze Release" and signals that the market may be about to make a significant move.
During periods of low volatility or sideways consolidation, the histogram will disappear.
2. Trend & Momentum Filter:
The color of the histogram bars is determined by the MACD and a fast EMA to gauge the direction and strength of the trend.
Lime: Strong Bullish Signal - The trend is up (MACD Cross-up) and short-term momentum is positive.
Red: Strong Bearish Signal - The trend is down (MACD Cross-down) and short-term momentum is negative.
Yellow: Weakening Momentum or Pullback - Indicates that while the primary trend is intact, short-term price is moving against it (e.g., a pullback in an uptrend).
3. Signal Line and Bar Coloring:
White Line: A moving average of the histogram, helping to visualize the general tendency of the volatility expansion.
Bar Coloring: The indicator also colors the price bars on the main chart to match the histogram (Lime, Red, Yellow) but only during a "Squeeze Release". This provides a clear visual cue directly on your chart.
---
How to Use
1. Look for the Squeeze: Identify periods where the histogram is flat (disappeared). This is the market consolidation phase.
2. Wait for the Release: The appearance of the first histogram bar signals that volatility is returning.
3. Confirm with Color:
Lime bars suggest a potential entry for a long position.
Red bars suggest a potential entry for a short position.
Yellow bars serve as a warning of a potential pullback or weakening trend; caution is advised.
Tip: For best results, use this indicator in conjunction with other technical analysis tools like support/resistance levels or volume analysis.
```
Skrip sumber terbuka
Dalam semangat sebenar TradingView, pencipta skrip ini telah menjadikannya sumber terbuka supaya pedagang dapat menilai dan mengesahkan kefungsiannya. Terima kasih kepada penulis! Walaupun anda boleh menggunakannya secara percuma, ingat bahawa menerbitkan semula kod ini adalah tertakluk kepada Peraturan Dalaman kami.
Penafian
Maklumat dan penerbitan adalah tidak dimaksudkan untuk menjadi, dan tidak membentuk, nasihat untuk kewangan, pelaburan, perdagangan dan jenis-jenis lain atau cadangan yang dibekalkan atau disahkan oleh TradingView. Baca dengan lebih lanjut di Terma Penggunaan.