OPEN-SOURCE SCRIPT
Telah dikemas kini Market Info Bar Charts - Was Bored
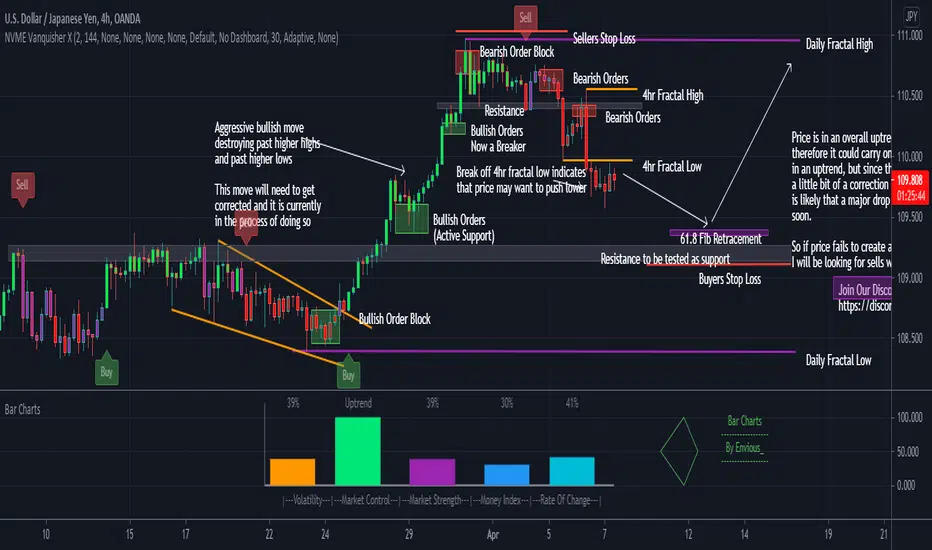
Simple script in a form of a bar chart showing you some market information ;)
Nota Keluaran
Added Information:Volatility is calculated using the relative volatility index
Market Control is calculated using exponential moving averages and the percent of the strength is based on how many bars the market goes on in that trend.
Market Strength is calculated with RSI and will change colour if it is overbought (red) or oversold (green)
Money Index is calculated with Money Flow Index
Rate of Change is calculated with ROC but it cannot go to a negative number and the max it can go up to is a 100%.
You can change anything in this market info bar chart indicator if you need :)
Nota Keluaran
Changed the font-size so that it suits the bar charts on different time-frames (still isn't fully accurate due to the limitation of font-sizes on pinescript)Skrip sumber terbuka
Dalam semangat TradingView sebenar, pencipta skrip ini telah menjadikannya sumber terbuka, jadi pedagang boleh menilai dan mengesahkan kefungsiannya. Terima kasih kepada penulis! Walaupuan anda boleh menggunakan secara percuma, ingat bahawa penerbitan semula kod ini tertakluk kepada Peraturan Dalaman.
Penafian
Maklumat dan penerbitan adalah tidak bertujuan, dan tidak membentuk, nasihat atau cadangan kewangan, pelaburan, dagangan atau jenis lain yang diberikan atau disahkan oleh TradingView. Baca lebih dalam Terma Penggunaan.
Skrip sumber terbuka
Dalam semangat TradingView sebenar, pencipta skrip ini telah menjadikannya sumber terbuka, jadi pedagang boleh menilai dan mengesahkan kefungsiannya. Terima kasih kepada penulis! Walaupuan anda boleh menggunakan secara percuma, ingat bahawa penerbitan semula kod ini tertakluk kepada Peraturan Dalaman.
Penafian
Maklumat dan penerbitan adalah tidak bertujuan, dan tidak membentuk, nasihat atau cadangan kewangan, pelaburan, dagangan atau jenis lain yang diberikan atau disahkan oleh TradingView. Baca lebih dalam Terma Penggunaan.