PROTECTED SOURCE SCRIPT
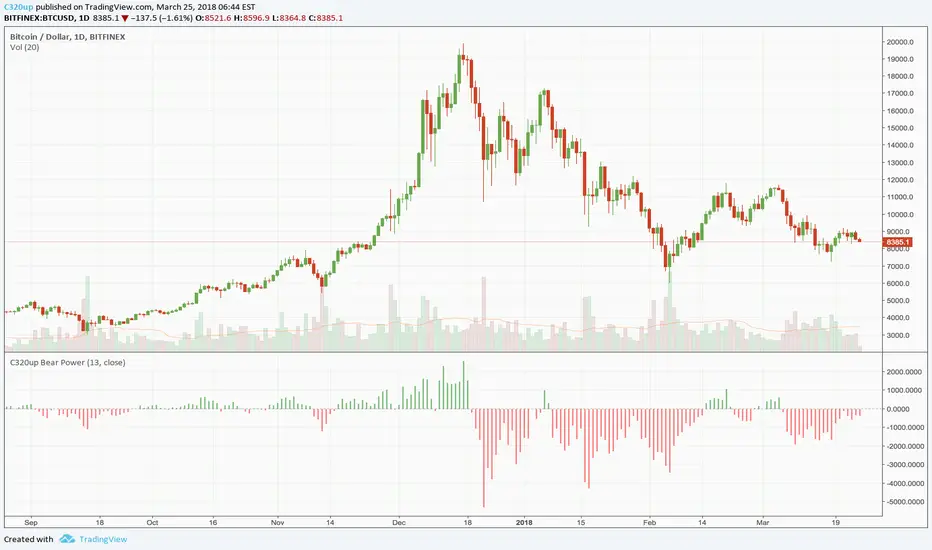
C320up Bear Power

C320up Bear Power
“The Bears Power oscillator was developed by Alexander Elder. It measures the difference between the lowest price and a 13-day Exponential Moving Average (EMA), plotted as a histogram. If the Bears Power indicator is below zero, it means sellers were able to drive price below the EMA. If the Bears Power indicator is above zero, it means buyers were able to keep the lowest price above the EMA. Bears Power is a fully unbounded oscillator with a base value of 0 and has no lower or upper limit. The indicator is often used in combination with other signals.” ~ TradingView
You can customise the colours of this indicator or change from histogram to area, line, etc., or a combination of these.
The default colours are Green (Bulls) for above zero, and Red (Bears) for below zero.
This indicator is not to be confused with Elder’s Force Index, which uses SMA and Volume.
Skrip dilindungi
Skrip ini diterbitkan sebagai sumber tertutup. Akan tetapi, anda boleh menggunakannya secara bebas dan tanpa apa-apa had – ketahui lebih di sini.
Penafian
Maklumat dan penerbitan adalah tidak bertujuan, dan tidak membentuk, nasihat atau cadangan kewangan, pelaburan, dagangan atau jenis lain yang diberikan atau disahkan oleh TradingView. Baca lebih dalam Terma Penggunaan.