PROTECTED SOURCE SCRIPT
GMS: SuperDuperTrend Indicator

Finally, I'm posting this!
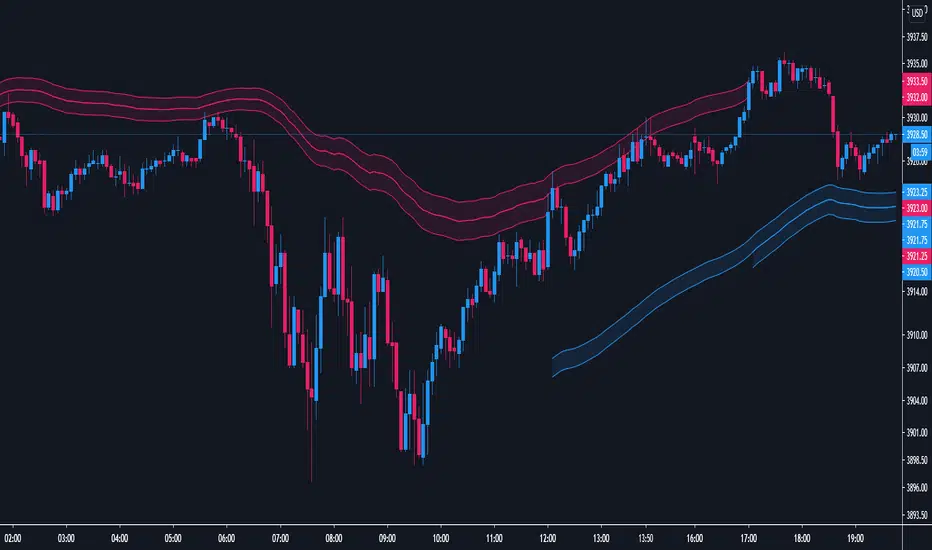
Okay so here's the deal. This is my variation of a supertrend indicator... in the sense that the colors and levels will swap back and forth like a traditional supertrend but these are obviously bands... The only possible adjustments are which moving average you want to use, it's length, the ATR length, and of course the input price.
Blue bands are support, red bands are resistance. As soon as you break support (blue) you will see the resistance (red) pop up and vice versa. It is possible to see both at the same time, that just indicates a range bound situation.
I really like this to a) identify trend and b) trade within the trend. So there are two ways to interpret this...
1. Trade with the trend - long on a breakout or short on a breakdown.
2. Trade within the trend - buy the dip within the uptrend or short the rip within a downtrend.
These levels could also be decent places to look to set stop losses too.
Personally I like the second method of trading within the trend, after all it is your friend... most of the time lol
The default settings are what I use and they tend to work on anytime frame, chart type, or market. But as always tinker with it a bit to find where and when it works best for you!
Hope this helps,
Andre
Skrip dilindungi
Skrip ini diterbitkan sebagai sumber tertutup. Akan tetapi, anda boleh menggunakannya secara bebas dan tanpa apa-apa had – ketahui lebih di sini.
Penafian
Maklumat dan penerbitan adalah tidak bertujuan, dan tidak membentuk, nasihat atau cadangan kewangan, pelaburan, dagangan atau jenis lain yang diberikan atau disahkan oleh TradingView. Baca lebih dalam Terma Penggunaan.