PROTECTED SOURCE SCRIPT
Telah dikemas kini SR Nube 1.1
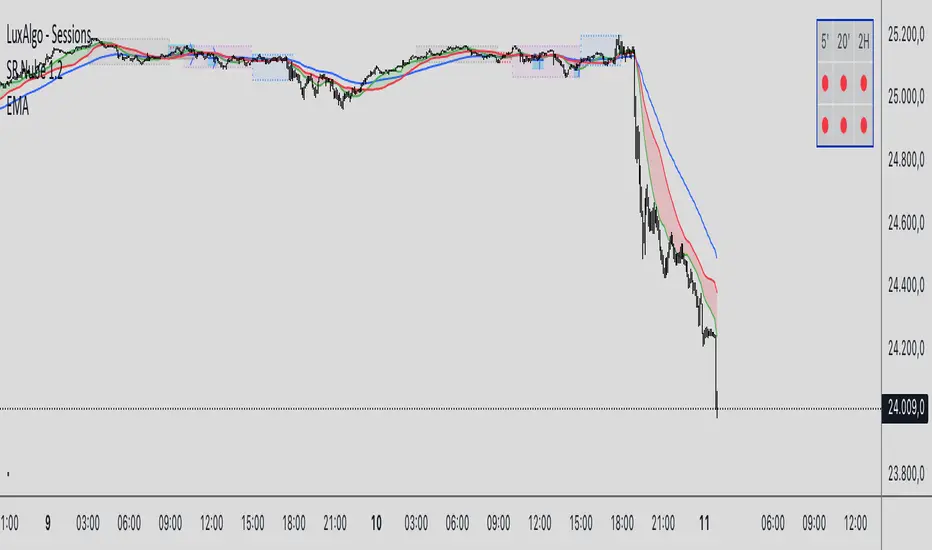
The SR Nube 1.1 indicator offers a comprehensive perspective on price action through the strategic combination of three key elements: a dynamic cloud based on two Volume Weighted Moving Averages (VWMA), a consistent reference Exponential Moving Average (EMA) across all timeframes, and an intuitive information table.
The Dynamic Cloud: This cloud is calculated using two VWMA with lengths that automatically adjust based on the chart's timeframe. This dynamic adaptation allows for the identification of relevant support and resistance zones across different timeframes, providing contextual insight into potential price movement. The cloud visualizes areas of volume confluence, helping traders pinpoint zones where buying or selling pressure may be significant.
The Consistent Reference EMA: An EMA with a specific length (calculated to be representative of a higher timeframe, such as 1 hour, and displayed consistently across all timeframes) is overlaid on the chart. This EMA serves as a macro trend guide and a constant visual reference point, making it easier to identify the overall market direction regardless of the active trading timeframe. Its consistency across timeframes helps maintain perspective and align trades with the dominant trend.
The Information Table: Located in the top-left corner of the chart, a concise table summarizes the current price status relative to the cloud (on the 20-minute timeframe, as a reference for the main strategy) and the price's position concerning the reference EMA (based on the 1-hour timeframe). This table provides a quick, color-coded overview of trend alignment across multiple key timeframes, which can assist traders in making more informed decisions.
Utility and Underlying Concepts:
This indicator is designed for traders seeking a tool that combines volume analysis (through the VWMA in the cloud) with a higher timeframe trend reference (the consistent EMA). The dynamic cloud helps identify potential entry and exit zones within the trading timeframe, while the reference EMA provides a directional filter. The information table simplifies the evaluation of trend confluence across multiple timeframes, potentially increasing the probability of successful trades.
The underlying strategy is based on the idea of trading in the direction of volume and in alignment with a higher timeframe trend, using the cloud to identify value areas and the EMA as a key directional filter. The information table acts as a quick visual aid for assessing this alignment.
How to Use:
Add the "SR Nube 1.1" indicator to your TradingView chart.
Observe the dynamic cloud to identify potential support and resistance zones on your trading timeframe.
Use the blue EMA as a guide for the overall market trend.
Consult the information table in the top-left corner to see the price alignment with the 20-minute cloud and the 1-hour EMA. The colors will provide a quick indication of the potential direction.
Look for confluence between the cloud signals on your trading timeframe, the price's position relative to the EMA, and the information provided in the table to identify potential entry and exit opportunities.
Nota Keluaran
The SR Nube 1.1 indicator offers a comprehensive perspective on price action through the strategic combination of three key elements: a dynamic cloud based on two Volume Weighted Moving Averages (VWMA), a consistent reference Exponential Moving Average (EMA) across all timeframes, and an intuitive information table.The Dynamic Cloud: This cloud is calculated using two VWMA with lengths that automatically adjust based on the chart's timeframe. This dynamic adaptation allows for the identification of relevant support and resistance zones across different timeframes, providing contextual insight into potential price movement. The cloud visualizes areas of volume confluence, helping traders pinpoint zones where buying or selling pressure may be significant.
The Consistent Reference EMA: An EMA with a specific length (calculated to be representative of a higher timeframe, such as 1 hour, and displayed consistently across all timeframes) is overlaid on the chart. This EMA serves as a macro trend guide and a constant visual reference point, making it easier to identify the overall market direction regardless of the active trading timeframe. Its consistency across timeframes helps maintain perspective and align trades with the dominant trend.
The Information Table: Located in the top-left corner of the chart, a concise table summarizes the current price status relative to the cloud (on the 20-minute timeframe, as a reference for the main strategy) and the price's position concerning the reference EMA (based on the 1-hour timeframe). This table provides a quick, color-coded overview of trend alignment across multiple key timeframes, which can assist traders in making more informed decisions.
Utility and Underlying Concepts:
This indicator is designed for traders seeking a tool that combines volume analysis (through the VWMA in the cloud) with a higher timeframe trend reference (the consistent EMA). The dynamic cloud helps identify potential entry and exit zones within the trading timeframe, while the reference EMA provides a directional filter. The information table simplifies the evaluation of trend confluence across multiple timeframes, potentially increasing the probability of successful trades.
The underlying strategy is based on the idea of trading in the direction of volume and in alignment with a higher timeframe trend, using the cloud to identify value areas and the EMA as a key directional filter. The information table acts as a quick visual aid for assessing this alignment.
How to Use:
Add the "SR Nube 1.1" indicator to your TradingView chart.
Observe the dynamic cloud to identify potential support and resistance zones on your trading timeframe.
Use the blue EMA as a guide for the overall market trend.
Consult the information table in the top-left corner to see the price alignment with the 20-minute cloud and the 1-hour EMA. The colors will provide a quick indication of the potential direction.
Look for confluence between the cloud signals on your trading timeframe, the price's position relative to the EMA, and the information provided in the table to identify potential entry and exit opportunities.
hace 7 minutos
Notas de prensa
The SR Nube 1.1 indicator offers a comprehensive perspective on price action through the strategic combination of three key elements: a dynamic cloud based on two Volume Weighted Moving Averages (VWMA), a consistent reference Exponential Moving Average (EMA) across all timeframes, and an intuitive information table.
The Dynamic Cloud: This cloud is calculated using two VWMA with lengths that automatically adjust based on the chart's timeframe. This dynamic adaptation allows for the identification of relevant support and resistance zones across different timeframes, providing contextual insight into potential price movement. The cloud visualizes areas of volume confluence, helping traders pinpoint zones where buying or selling pressure may be significant.
The Consistent Reference EMA: An EMA with a specific length (calculated to be representative of a higher timeframe, such as 1 hour, and displayed consistently across all timeframes) is overlaid on the chart. This EMA serves as a macro trend guide and a constant visual reference point, making it easier to identify the overall market direction regardless of the active trading timeframe. Its consistency across timeframes helps maintain perspective and align trades with the dominant trend.
The Information Table: Located in the top-left corner of the chart, a concise table summarizes the current price status relative to the cloud (on the 20-minute timeframe, as a reference for the main strategy) and the price's position concerning the reference EMA (based on the 1-hour timeframe). This table provides a quick, color-coded overview of trend alignment across multiple key timeframes, which can assist traders in making more informed decisions.
Utility and Underlying Concepts:
This indicator is designed for traders seeking a tool that combines volume analysis (through the VWMA in the cloud) with a higher timeframe trend reference (the consistent EMA). The dynamic cloud helps identify potential entry and exit zones within the trading timeframe, while the reference EMA provides a directional filter. The information table simplifies the evaluation of trend confluence across multiple timeframes, potentially increasing the probability of successful trades.
The underlying strategy is based on the idea of trading in the direction of volume and in alignment with a higher timeframe trend, using the cloud to identify value areas and the EMA as a key directional filter. The information table acts as a quick visual aid for assessing this alignment.
How to Use:
Add the "SR Nube 1.1" indicator to your TradingView chart.
Observe the dynamic cloud to identify potential support and resistance zones on your trading timeframe.
Use the blue EMA as a guide for the overall market trend.
Consult the information table in the top-left corner to see the price alignment with the 20-minute cloud and the 1-hour EMA. The colors will provide a quick indication of the potential direction.
Look for confluence between the cloud signals on your trading timeframe, the price's position relative to the EMA, and the information provided in the table to identify potential entry and exit opportunities.
Nota Keluaran
SR Nube 1.1: Comprehensive Price Action AnalysisThe SR Nube 1.1 indicator offers a powerful perspective on price action by strategically combining two key elements: a dynamic cloud based on two Volume Weighted Moving Averages (VWMA) and an intuitive information table for multi-timeframe analysis.
The Dynamic Cloud
This central feature of the indicator is calculated using two Volume Weighted Moving Averages (VWMA). Their lengths automatically adjust based on the chart's current timeframe. This dynamic adaptation is crucial for identifying relevant support and resistance zones across different timeframes, providing essential contextual insight into potential price movements. The cloud visually highlights areas where volume is significant, helping traders pinpoint zones where buying or selling pressure may be notable.
The Information Table
Located in the top-right corner of your chart, a concise table summarizes the current price status relative to the cloud on several key timeframes. This table now includes the 20-minute (20'), 2-hour (2H), 4-hour (4H), and 1-day (1D) timeframes. It provides a quick, color-coded overview of trend alignment across these multiple timeframes, assisting traders in making more informed decisions at a glance.
Utility and Underlying Concepts
This indicator is designed for traders seeking a tool that deeply integrates volume analysis through the VWMA in the cloud. The dynamic cloud helps identify potential entry and exit zones within your active trading timeframe.
The underlying strategy is based on the idea of trading in the direction of volume, using the cloud to identify value areas. The information table acts as a swift visual aid for assessing this alignment across different timeframes.
How to Use
Add the "SR Nube 1.1" indicator to your TradingView chart.
Observe the dynamic cloud to identify potential support and resistance zones on your trading timeframe.
Consult the information table in the top-right corner to see the price alignment with the cloud across the 20', 2H, 4H, and 1D timeframes. The colors will provide a quick indication of the potential direction.
Look for confluence between the cloud signals on your trading timeframe and the information provided in the table to identify potential entry and exit opportunities.
Nota Keluaran
The SR Nube 1.1 indicator offers a comprehensive perspective on price action through the strategic combination of three key elements: a dynamic cloud based on two Volume Weighted Moving Averages (VWMA), a consistent reference Exponential Moving Average (EMA) across all timeframes, and an intuitive information table.The Dynamic Cloud: This cloud is calculated using two VWMA with lengths that automatically adjust based on the chart's timeframe. This dynamic adaptation allows for the identification of relevant support and resistance zones across different timeframes, providing contextual insight into potential price movement. The cloud visualizes areas of volume confluence, helping traders pinpoint zones where buying or selling pressure may be significant.
The Consistent Reference EMA: An EMA with a specific length (calculated to be representative of a higher timeframe, such as 1 hour, and displayed consistently across all timeframes) is overlaid on the chart. This EMA serves as a macro trend guide and a constant visual reference point, making it easier to identify the overall market direction regardless of the active trading timeframe. Its consistency across timeframes helps maintain perspective and align trades with the dominant trend.
The Information Table: Located in the top-left corner of the chart, a concise table summarizes the current price status relative to the cloud (on the 20-minute timeframe, as a reference for the main strategy) and the price's position concerning the reference EMA (based on the 1-hour timeframe). This table provides a quick, color-coded overview of trend alignment across multiple key timeframes, which can assist traders in making more informed decisions.
Utility and Underlying Concepts:
This indicator is designed for traders seeking a tool that combines volume analysis (through the VWMA in the cloud) with a higher timeframe trend reference (the consistent EMA). The dynamic cloud helps identify potential entry and exit zones within the trading timeframe, while the reference EMA provides a directional filter. The information table simplifies the evaluation of trend confluence across multiple timeframes, potentially increasing the probability of successful trades.
The underlying strategy is based on the idea of trading in the direction of volume and in alignment with a higher timeframe trend, using the cloud to identify value areas and the EMA as a key directional filter. The information table acts as a quick visual aid for assessing this alignment.
How to Use:
Add the "SR Nube 1.1" indicator to your TradingView chart.
Observe the dynamic cloud to identify potential support and resistance zones on your trading timeframe.
Use the blue EMA as a guide for the overall market trend.
Consult the information table in the top-left corner to see the price alignment with the 20-minute cloud and the 1-hour EMA. The colors will provide a quick indication of the potential direction.
Look for confluence between the cloud signals on your trading timeframe, the price's position relative to the EMA, and the information provided in the table to identify potential entry and exit opportunities.
24 may
Notas de prensa
The SR Nube 1.1 indicator offers a comprehensive perspective on price action through the strategic combination of three key elements: a dynamic cloud based on two Volume Weighted Moving Averages (VWMA), a consistent reference Exponential Moving Average (EMA) across all timeframes, and an intuitive information table.
The Dynamic Cloud: This cloud is calculated using two VWMA with lengths that automatically adjust based on the chart's timeframe. This dynamic adaptation allows for the identification of relevant support and resistance zones across different timeframes, providing contextual insight into potential price movement. The cloud visualizes areas of volume confluence, helping traders pinpoint zones where buying or selling pressure may be significant.
The Consistent Reference EMA: An EMA with a specific length (calculated to be representative of a higher timeframe, such as 1 hour, and displayed consistently across all timeframes) is overlaid on the chart. This EMA serves as a macro trend guide and a constant visual reference point, making it easier to identify the overall market direction regardless of the active trading timeframe. Its consistency across timeframes helps maintain perspective and align trades with the dominant trend.
The Information Table: Located in the top-left corner of the chart, a concise table summarizes the current price status relative to the cloud (on the 20-minute timeframe, as a reference for the main strategy) and the price's position concerning the reference EMA (based on the 1-hour timeframe). This table provides a quick, color-coded overview of trend alignment across multiple key timeframes, which can assist traders in making more informed decisions.
Utility and Underlying Concepts:
This indicator is designed for traders seeking a tool that combines volume analysis (through the VWMA in the cloud) with a higher timeframe trend reference (the consistent EMA). The dynamic cloud helps identify potential entry and exit zones within the trading timeframe, while the reference EMA provides a directional filter. The information table simplifies the evaluation of trend confluence across multiple timeframes, potentially increasing the probability of successful trades.
The underlying strategy is based on the idea of trading in the direction of volume and in alignment with a higher timeframe trend, using the cloud to identify value areas and the EMA as a key directional filter. The information table acts as a quick visual aid for assessing this alignment.
How to Use:
Add the "SR Nube 1.1" indicator to your TradingView chart.
Observe the dynamic cloud to identify potential support and resistance zones on your trading timeframe.
Use the blue EMA as a guide for the overall market trend.
Consult the information table in the top-left corner to see the price alignment with the 20-minute cloud and the 1-hour EMA. The colors will provide a quick indication of the potential direction.
Look for confluence between the cloud signals on your trading timeframe, the price's position relative to the EMA, and the information provided in the table to identify potential entry and exit opportunities.
Nota Keluaran
New version.Skrip dilindungi
Skrip ini diterbitkan sebagai sumber tertutup. Akan tetapi, anda boleh menggunakannya secara bebas dan tanpa apa-apa had – ketahui lebih di sini.
Penafian
Maklumat dan penerbitan adalah tidak bertujuan, dan tidak membentuk, nasihat atau cadangan kewangan, pelaburan, dagangan atau jenis lain yang diberikan atau disahkan oleh TradingView. Baca lebih dalam Terma Penggunaan.
Skrip dilindungi
Skrip ini diterbitkan sebagai sumber tertutup. Akan tetapi, anda boleh menggunakannya secara bebas dan tanpa apa-apa had – ketahui lebih di sini.
Penafian
Maklumat dan penerbitan adalah tidak bertujuan, dan tidak membentuk, nasihat atau cadangan kewangan, pelaburan, dagangan atau jenis lain yang diberikan atau disahkan oleh TradingView. Baca lebih dalam Terma Penggunaan.