OPEN-SOURCE SCRIPT
Kimchi Premium Dashboard (Final)
📜 Kimchi Premium Dashboard (Live & Daily Log)
🚀 Summary
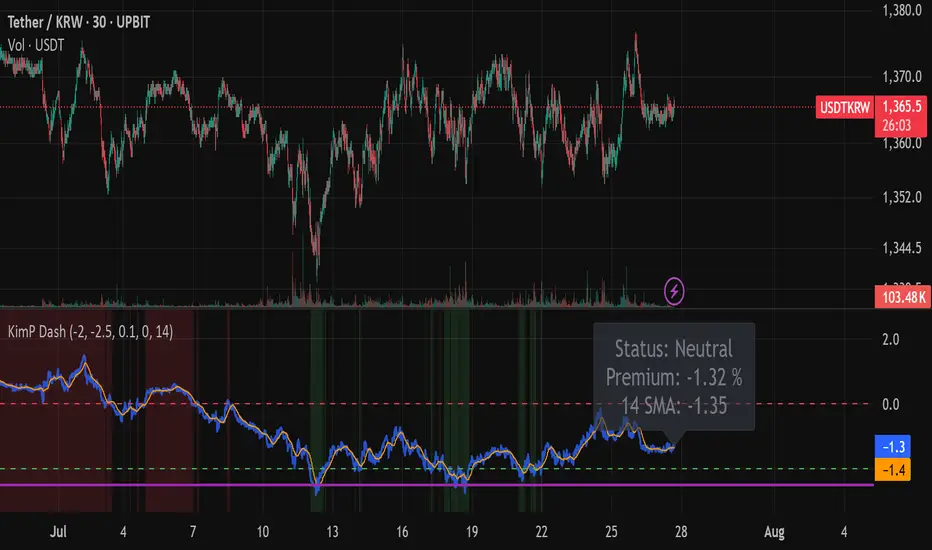
This indicator is an all-in-one dashboard that tracks the real-time price difference of USDT (Tether) between a Korean exchange (Upbit) and a global exchange (Coinbase). This difference is commonly known as the "Kimchi Premium" (Kimp) or "Reverse Premium."
Going beyond a simple premium display, this tool is designed to assist with arbitrage and swing trading strategies by providing intuitive visualizations, a smart multi-tier alert system, and a daily data logging feature.
✨ Key Features
Real-time Premium Calculation: Accurately calculates the premium in percentage (%) based on the USDT prices from Upbit and Coinbase, and the live USD/KRW exchange rate.
Intuitive Zone Visualization: Instantly identify whether the premium is in a Buy, Sell, or Neutral zone through dynamic background coloring.
Smart Alert System: Delivers systematic alerts for key events like the initial -2.0% entry, a critical -2.5% breach, and subsequent new lows, all without unnecessary spam. (Can be toggled ON/OFF in settings).
Hybrid Dashboard: Features both a real-time status label and a daily log that records the day's significant low points.
📊 Visual Components Explained
Lines
🔵 Blue Line (Premium Line): This is the core real-time premium value (%). The position of this line is most important.
🟠 Orange Line (SMA Line): This is the moving average of the premium. It helps identify the overall trend beyond short-term volatility.
Zones
🟩 Green Zone (Buy Zone): This area, typically below -2.0%, indicates a "Reverse Premium" where the Korean price is significantly lower than the global price. It represents a potential buying opportunity for arbitrage.
🟥 Red Zone (Kimp Zone): This area, typically above 0%, indicates a "Kimchi Premium" where the Korean price is higher. This represents a potential selling or profit-taking opportunity.
Dashboard
Live Status Label: Located on the right, this label displays the precise premium value, the current zone status (Buy/Sell/Neutral), and the SMA value in real-time.
Today's Lows Log: Located on the left, this table records the time and level of significant lows (below -2.5%) broken during the day. It resets automatically at midnight (UTC).
🔔 Alerts & How to Use
This indicator provides a systematic 3-tier alert system designed for arbitrage strategies. (Must be enabled via "Enable Real-time Alerts?" in settings).
✅ Good Opportunity (-2.0%): A one-time alert triggers upon the first entry into the initial buying zone.
🚨 BIG Opportunity (-2.5%): A distinct, high-priority alert triggers when this more critical level is breached.
📞 Granular Tracking (Below -2.5%): Receive alerts for each new low in -0.1% increments for precise tracking during the best opportunities.
A recommended hybrid strategy is to keep alerts off for daily review using the "Today's Lows Log," and turn them on only during critical periods for real-time action.
Disclaimer: The information provided by this indicator is for reference purposes only and does not constitute financial advice. All investment decisions and risks are the sole responsibility of the user.
🚀 Summary
This indicator is an all-in-one dashboard that tracks the real-time price difference of USDT (Tether) between a Korean exchange (Upbit) and a global exchange (Coinbase). This difference is commonly known as the "Kimchi Premium" (Kimp) or "Reverse Premium."
Going beyond a simple premium display, this tool is designed to assist with arbitrage and swing trading strategies by providing intuitive visualizations, a smart multi-tier alert system, and a daily data logging feature.
✨ Key Features
Real-time Premium Calculation: Accurately calculates the premium in percentage (%) based on the USDT prices from Upbit and Coinbase, and the live USD/KRW exchange rate.
Intuitive Zone Visualization: Instantly identify whether the premium is in a Buy, Sell, or Neutral zone through dynamic background coloring.
Smart Alert System: Delivers systematic alerts for key events like the initial -2.0% entry, a critical -2.5% breach, and subsequent new lows, all without unnecessary spam. (Can be toggled ON/OFF in settings).
Hybrid Dashboard: Features both a real-time status label and a daily log that records the day's significant low points.
📊 Visual Components Explained
Lines
🔵 Blue Line (Premium Line): This is the core real-time premium value (%). The position of this line is most important.
🟠 Orange Line (SMA Line): This is the moving average of the premium. It helps identify the overall trend beyond short-term volatility.
Zones
🟩 Green Zone (Buy Zone): This area, typically below -2.0%, indicates a "Reverse Premium" where the Korean price is significantly lower than the global price. It represents a potential buying opportunity for arbitrage.
🟥 Red Zone (Kimp Zone): This area, typically above 0%, indicates a "Kimchi Premium" where the Korean price is higher. This represents a potential selling or profit-taking opportunity.
Dashboard
Live Status Label: Located on the right, this label displays the precise premium value, the current zone status (Buy/Sell/Neutral), and the SMA value in real-time.
Today's Lows Log: Located on the left, this table records the time and level of significant lows (below -2.5%) broken during the day. It resets automatically at midnight (UTC).
🔔 Alerts & How to Use
This indicator provides a systematic 3-tier alert system designed for arbitrage strategies. (Must be enabled via "Enable Real-time Alerts?" in settings).
✅ Good Opportunity (-2.0%): A one-time alert triggers upon the first entry into the initial buying zone.
🚨 BIG Opportunity (-2.5%): A distinct, high-priority alert triggers when this more critical level is breached.
📞 Granular Tracking (Below -2.5%): Receive alerts for each new low in -0.1% increments for precise tracking during the best opportunities.
A recommended hybrid strategy is to keep alerts off for daily review using the "Today's Lows Log," and turn them on only during critical periods for real-time action.
Disclaimer: The information provided by this indicator is for reference purposes only and does not constitute financial advice. All investment decisions and risks are the sole responsibility of the user.
Skrip sumber terbuka
Dalam semangat TradingView sebenar, pencipta skrip ini telah menjadikannya sumber terbuka, jadi pedagang boleh menilai dan mengesahkan kefungsiannya. Terima kasih kepada penulis! Walaupuan anda boleh menggunakan secara percuma, ingat bahawa penerbitan semula kod ini tertakluk kepada Peraturan Dalaman.
Penafian
Maklumat dan penerbitan adalah tidak bertujuan, dan tidak membentuk, nasihat atau cadangan kewangan, pelaburan, dagangan atau jenis lain yang diberikan atau disahkan oleh TradingView. Baca lebih dalam Terma Penggunaan.