OPEN-SOURCE SCRIPT
RSI - colour fill
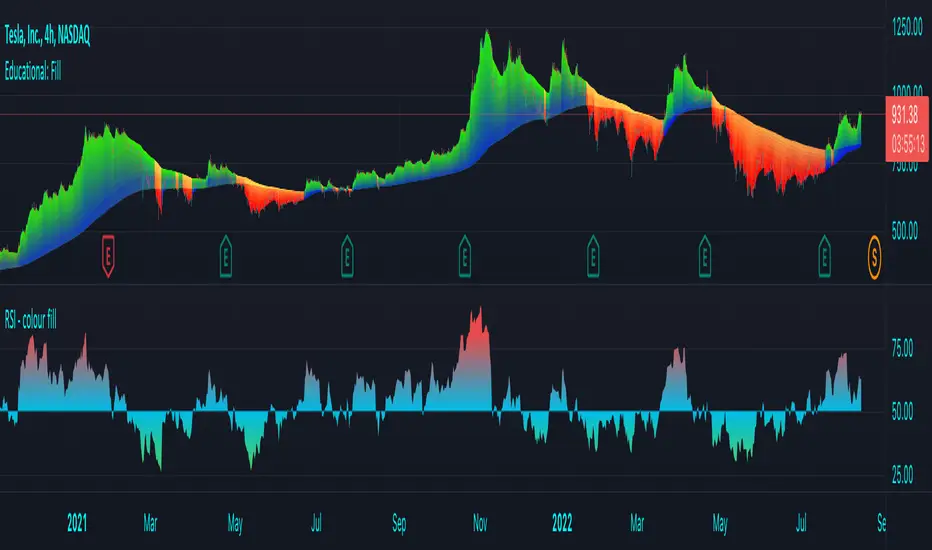
This script showcases the new (overload) feature regarding the fill() function! 🥳
2 plots could be filled before, but with just 1 colour per bar, now the colour can be a gradient type.
In this example we have 2 plots
- rsiPlot , which plots the rsi value
- centerPlot, which plots the value 50 ('centre line')
Explanation of colour fill in the zone 50-80
Default when rsi > 50
- a bottom value is set at 50 (associated with colour aqua)
- and a top value is set at 80 (associated with colour red)
This zone (bottom -> top value) is filled with a gradient colour (50 - aqua -> 80 - red)
When rsi is towards 80, you see a red coloured zone at the rsi value,
while when rsi is around 50, you'll only see the colour aqua
The same principle is applied in the zone 20-50 when rsi < 50
Cheers!
Skrip sumber terbuka
Dalam semangat sebenar TradingView, pencipta skrip ini telah menjadikannya sumber terbuka supaya pedagang dapat menilai dan mengesahkan kefungsiannya. Terima kasih kepada penulis! Walaupun anda boleh menggunakannya secara percuma, ingat bahawa menerbitkan semula kod ini adalah tertakluk kepada Peraturan Dalaman kami.
Who are PineCoders?
tradingview.com/chart/SSP/yW5eOqtm-Who-are-PineCoders/
TG Pine Script® Q&A: t.me/PineCodersQA
- We cannot control our emotions,
but we can control our keyboard -
tradingview.com/chart/SSP/yW5eOqtm-Who-are-PineCoders/
TG Pine Script® Q&A: t.me/PineCodersQA
- We cannot control our emotions,
but we can control our keyboard -
Penafian
Maklumat dan penerbitan adalah tidak dimaksudkan untuk menjadi, dan tidak membentuk, nasihat untuk kewangan, pelaburan, perdagangan dan jenis-jenis lain atau cadangan yang dibekalkan atau disahkan oleh TradingView. Baca dengan lebih lanjut di Terma Penggunaan.