OPEN-SOURCE SCRIPT
Ehlers Smoothed Stochastic & RSI with Roofing Filters
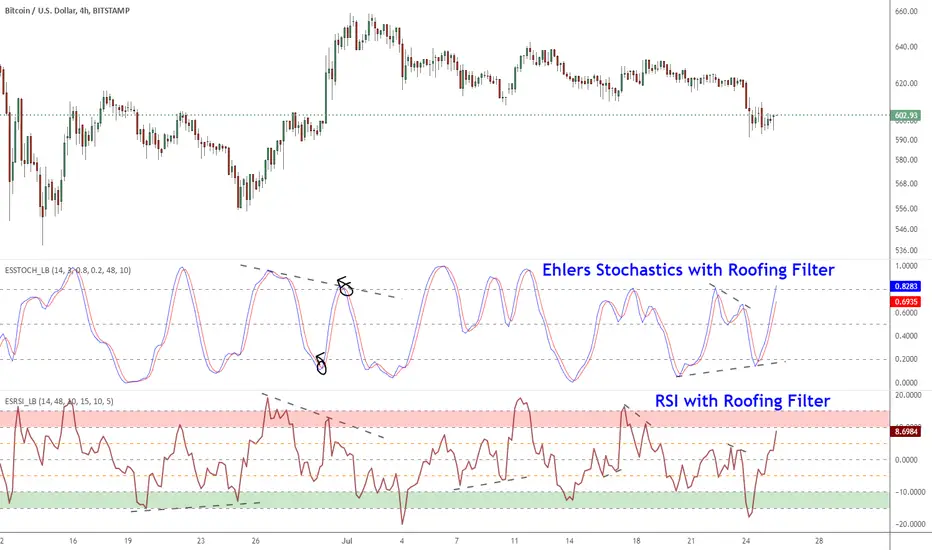
Roofing filters, first discussed by Mr.John Ehlers, act as a passband, filtering out unwanted noise from market data and accentuating turning points.
I have included 2 indicators with filters enabled. Both support double smoothing via options page. All the parameters are configurable.
Info on Roofing Filter and Ehlers Super Smoother:
----------------------------------------------------
The Ehlers' Roofing Filter is an expansion on Ehlers Super Smoother Filter, both being smoothing techniques based on analog filters. This filter aims at reducing noise in price data.
In Super Smoother Filter, regardless of the time frame used, all waves having cycles of less than 10 bars are considered noise (customizable via options page). The Roofing Filter uses this principle, however, it also creates a so-called "roof" by eliminating wave components having cycles greater than 48 bars which are perceived as "spectral dilation". Thus, the filter only passes those spectral components whose periods are between 10 and 48 bars. This technique noticeably reduces indicator lag and also helps assess turning points more accurately.
More info:
- Spectral dilation paper: mesasoftware.com/Seminars/SpectralDilation.pdf
- John Ehlers presentation: youtube.com/watch?v=BR5pDiPYsnw
------------------------------------------------------
If you want to use RSI %B and Bandwidth, follow this guide to "Make mine" this chart and get access to the source:
drive.google.com/file/d/0Bx48Du_2aPFncUhIemNrZUY1dTA/edit?usp=sharing
For the complete list of my indicators, check this post:
tradingview.com/v/4IneGo8h/
Skrip sumber terbuka
Dalam semangat sebenar TradingView, pencipta skrip ini telah menjadikannya sumber terbuka supaya pedagang dapat menilai dan mengesahkan kefungsiannya. Terima kasih kepada penulis! Walaupun anda boleh menggunakannya secara percuma, ingat bahawa menerbitkan semula kod ini adalah tertakluk kepada Peraturan Dalaman kami.
List of my free indicators: bit.ly/1LQaPK8
List of my indicators at Appstore: blog.tradingview.com/?p=970
List of my indicators at Appstore: blog.tradingview.com/?p=970
Penafian
Maklumat dan penerbitan adalah tidak dimaksudkan untuk menjadi, dan tidak membentuk, nasihat untuk kewangan, pelaburan, perdagangan dan jenis-jenis lain atau cadangan yang dibekalkan atau disahkan oleh TradingView. Baca dengan lebih lanjut di Terma Penggunaan.