WinkyTwinki

Hi-Lo World

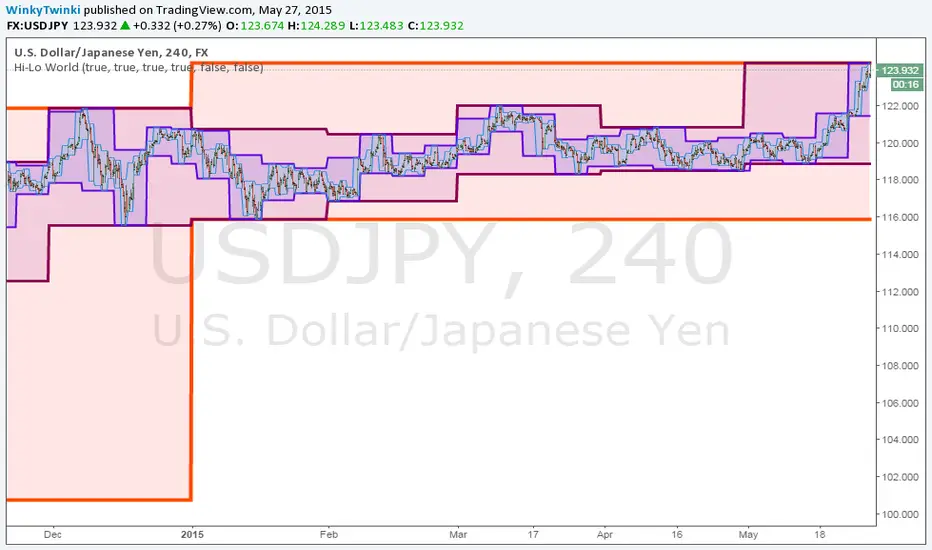
This script plots the highs/lows from multiple timeframes onto the same chart to help you spot the prevailing long-term, medium-term and short-term trends.

List of timeframes included:
  • Year
  • Month
  • Week
  • Day
  • 4 Hour
  • Hour
You can select which timeframes to plot by editing the inputs on the Format Object dialog.
Skrip sumber terbuka

Dalam semangat TradingView yang sebenar, penulis skrip ini telah menerbitkannya dengan menggunakan sumber terbuka supaya pedagang-pedagang dapat memahami dan mengesahkannya. Sorakan kepada penulis! Anda dapat menggunakannya secara percuma tetapi penggunaan semula kod ini dalam penerbitan adalah dikawalselia oleh Peraturan Dalaman. Anda boleh menyukainya untuk menggunakannya pada carta.

Penafian

Maklumat dan penerbitan adalah tidak dimaksudkan untuk menjadi, dan tidak membentuk, nasihat untuk kewangan, pelaburan, perdagangan dan jenis-jenis lain atau cadangan yang dibekalkan atau disahkan oleh TradingView. Baca dengan lebih lanjut di Terma Penggunaan.

Ingin menggunakan skrip ini pada carta?
study("Hi-Lo World", overlay=true)

y_color = red       // Color used to plot yearly highs/lows
m_color = purple    // Color used to plot monthly highs/lows
w_color = blue      // Color used to plot weekly highs/lows
d_color = aqua      // Color used to plot daily highs/lows
h4_color = green    // Color used to plot 4-hourly highs/lows
h_color = lime      // Color used to plot hourly highs/lows

plot_y = input(title="Year", type=bool, defval=true)        // plot yearly highs/lows
plot_m = input(title="Month", type=bool, defval=true)       // plot monthly highs/lows
plot_w = input(title="Week", type=bool, defval=true)        // plot weekly highs/lows
plot_d = input(title="Day", type=bool, defval=true)         // plot daily highs/lows
plot_h4 = input(title="4 Hour", type=bool, defval=false)    // plot 4-hourly highs/lows
plot_h = input(title="Hour", type=bool, defval=false)       // plot hourly highs/lows

// Get highs/lows
high_y = security(tickerid, "12M", high)
low_y = security(tickerid, "12M", low)
high_m = security(tickerid, "M", high)
low_m = security(tickerid, "M", low)
high_w = security(tickerid, "W", high)
low_w = security(tickerid, "W", low)
high_d = security(tickerid, "D", high)
low_d = security(tickerid, "D", low)
high_h4 = security(tickerid, "240", high)
low_h4 = security(tickerid, "240", low)
high_h = security(tickerid, "60", high)
low_h = security(tickerid, "60", low)

// Plot highs/lows
high_y_plot = plot(plot_y ? high_y : na, color=y_color, linewidth=4)
low_y_plot = plot(plot_y ? low_y : na, color=y_color, linewidth=4)
high_m_plot = plot(plot_m ? high_m : na, color=m_color, linewidth=3)
low_m_plot = plot(plot_m ? low_m : na, color=m_color, linewidth=3)
high_w_plot = plot(plot_w ? high_w : na, color=w_color, linewidth=2)
low_w_plot = plot(plot_w ? low_w : na, color=w_color, linewidth=2)
high_d_plot = plot(plot_d ? high_d : na, color=d_color)
low_d_plot = plot(plot_d ? low_d : na, color=d_color)
high_h4_plot = plot(plot_h4 ? high_h4 : na, color=h4_color)
low_h4_plot = plot(plot_h4 ? low_h4 : na, color=h4_color)
high_h_plot = plot(plot_h ? high_h : na, color=h_color)
low_h_plot = plot(plot_h ? low_h : na, color=h_color)
fill(high_y_plot, low_y_plot, color=y_color)
fill(high_m_plot, low_m_plot, color=m_color)
fill(high_w_plot, low_w_plot, color=w_color)
fill(high_d_plot, low_d_plot, color=d_color)
fill(high_h4_plot, low_h4_plot, color=h4_color)
fill(high_h_plot, low_h_plot, color=h_color)