PROTECTED SOURCE SCRIPT
Trigger Line Candles
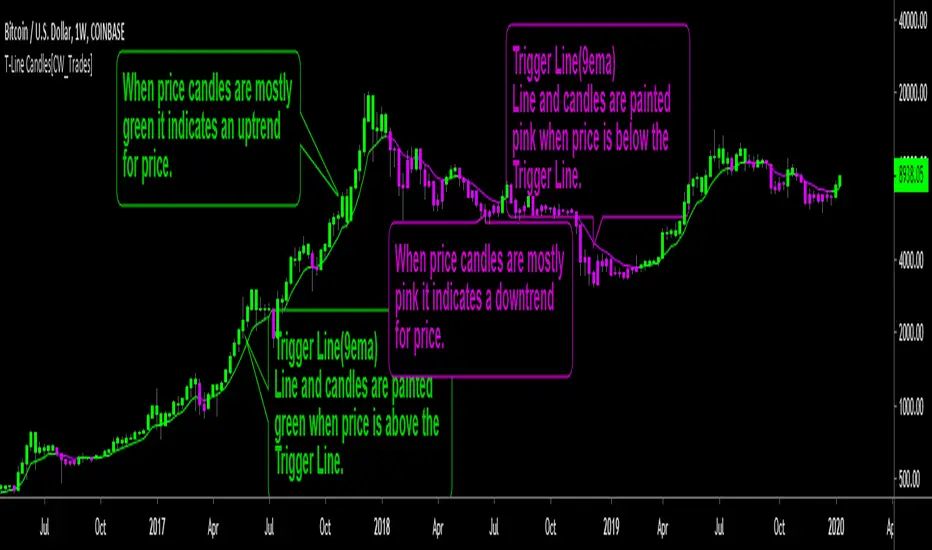
This is a trend indicator utilizing a 9-period exponential moving average, known as the Trigger Line. When price is above the Trigger Line both the candles and Trigger Line are colored green, indicating an uptrend for price. Price will tend to find support at the Trigger Line when trending above the Trigger Line. When price is below the Trigger Line both the candles and the Trigger Line are colored pink, indicating a downtrend for price. Price will tend to find resistance at the Trigger Line when trending below the Trigger Line.
Coloring price candles based on price relation to the Trigger Line paints a clearer picture of the true short-term trend behind price, rather than traditional price candles which only paint price in two colors representing individual candle up and down movement while no short-term trend identification is utilized.
Indicator inputs are editable; candle colors and T-Line can be turned on/off.
Indicator inspired by Stephen Bigalow's T-Line strategy.
Skrip dilindungi
Skrip ini diterbitkan sebagai sumber tertutup. Akan tetapi, anda boleh menggunakannya secara bebas dan tanpa apa-apa had – ketahui lebih di sini.
Penafian
Maklumat dan penerbitan adalah tidak bertujuan, dan tidak membentuk, nasihat atau cadangan kewangan, pelaburan, dagangan atau jenis lain yang diberikan atau disahkan oleh TradingView. Baca lebih dalam Terma Penggunaan.