OPEN-SOURCE SCRIPT
Herrick Payoff Index for Quandl Data
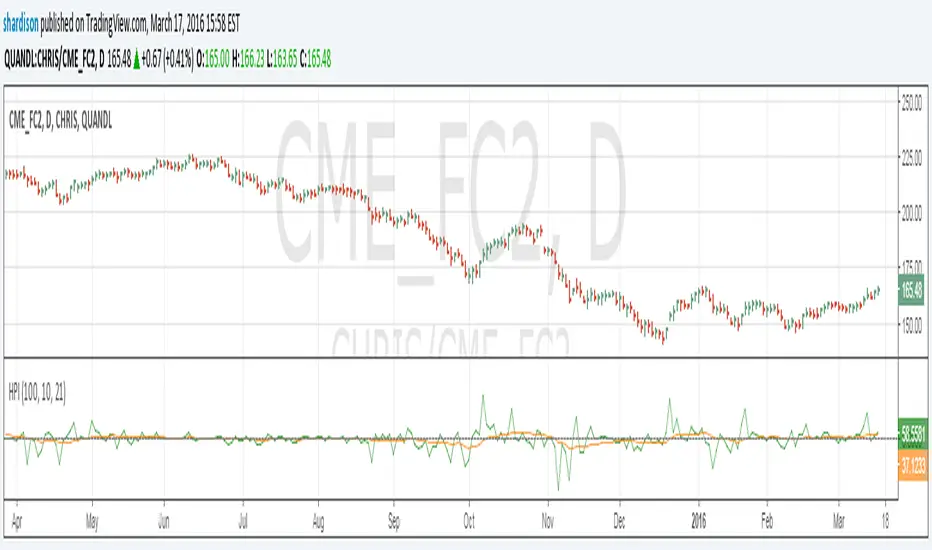
Update to my previous Herrick Payoff Index script. This script pulls Quandl futures data with daily open interest. The prior version only used the weekly Commitment of Traders open interest data so could only be used on weekly bars. Note: Must use Quandl Symbol methodology in chart (i.e. enter symbol as QUANDL:CHRIS/CME_FC2, QUANDL:CME/FCX2016, ect.). Unfortunately, I haven't been able to program this to pull from the embedded futures data.
Skrip sumber terbuka
Dalam semangat sebenar TradingView, pencipta skrip ini telah menjadikannya sumber terbuka supaya pedagang dapat menilai dan mengesahkan kefungsiannya. Terima kasih kepada penulis! Walaupun anda boleh menggunakannya secara percuma, ingat bahawa menerbitkan semula kod ini adalah tertakluk kepada Peraturan Dalaman kami.
Need seasonals for futures data on NQ, ES, YM, or other commodities. Check out agresticresearch.com.
Penafian
Maklumat dan penerbitan adalah tidak dimaksudkan untuk menjadi, dan tidak membentuk, nasihat untuk kewangan, pelaburan, perdagangan dan jenis-jenis lain atau cadangan yang dibekalkan atau disahkan oleh TradingView. Baca dengan lebih lanjut di Terma Penggunaan.