OPEN-SOURCE SCRIPT
Weighted Momentum and Volatility Indicator (WMI)
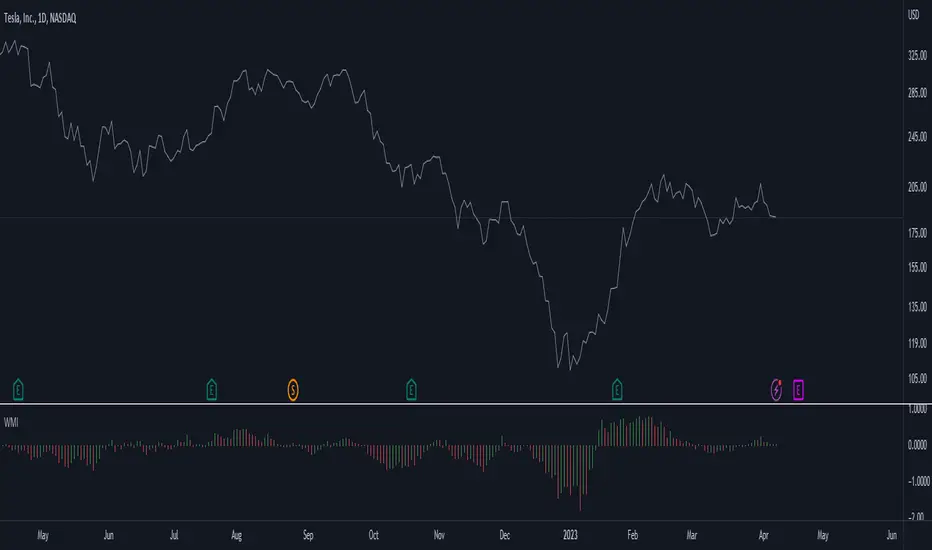
The Weighted Momentum and Volatility Indicator (WMI) is a composite technical analysis tool that combines momentum and volatility to identify potential trend changes in the underlying asset.
The WMI is displayed as an histogram that oscillates around a zero line, with increasing bars indicating a bullish trend and decreasing bars indicating a bearish trend.
The WMI is calculated by combining the Rate of Change (ROC) and Average True Range (ATR) indicators.
The ROC measures the percentage change in price over a set period of time, while the ATR measures the volatility of the asset over the same period.
The WMI is calculated by multiplying the normalized values of the ROC and ATR indicators, with the normalization process being used to adjust the values to a scale between 0 and 1.
Traders and investors can use the WMI to identify potential trend changes in the underlying asset, with increasing bars indicating a bullish trend and decreasing bars indicating a bearish trend.
The WMI can be used in conjunction with other technical analysis tools to develop a comprehensive trading strategy.
Do not hesitate to let me know your comments if you see any improvements to be made :)
Skrip sumber terbuka
Dalam semangat TradingView sebenar, pencipta skrip ini telah menjadikannya sumber terbuka, jadi pedagang boleh menilai dan mengesahkan kefungsiannya. Terima kasih kepada penulis! Walaupuan anda boleh menggunakan secara percuma, ingat bahawa penerbitan semula kod ini tertakluk kepada Peraturan Dalaman.
Plan the trade ⚡ Trade the plan
Penafian
Maklumat dan penerbitan adalah tidak bertujuan, dan tidak membentuk, nasihat atau cadangan kewangan, pelaburan, dagangan atau jenis lain yang diberikan atau disahkan oleh TradingView. Baca lebih dalam Terma Penggunaan.