OPEN-SOURCE SCRIPT
Price Relative / Relative Strength
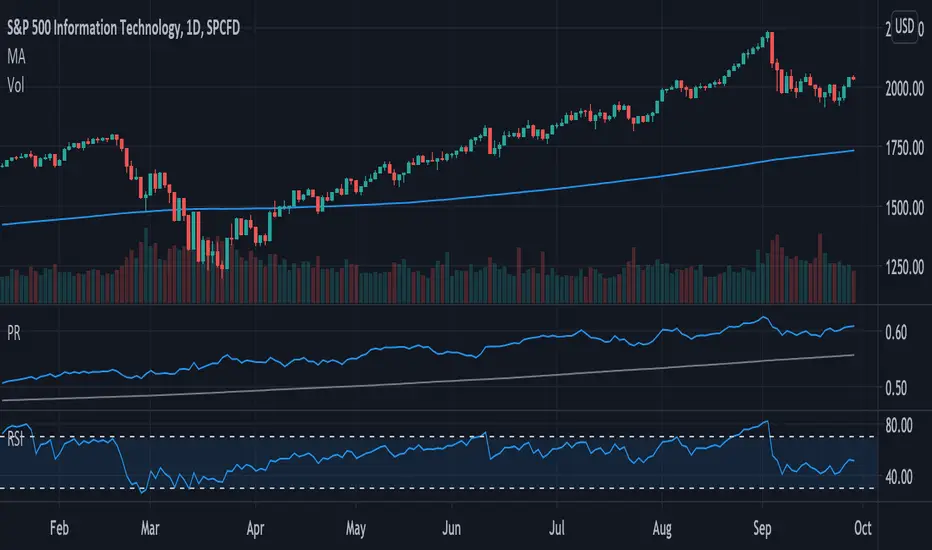
The Price Relative indicator compares the performance of one security to another. This indicator can be used to compare the performance of a stock against a benchmark index, such as the S&P 500, or its sector/industry group. This makes it possible to determine if a stock is leading or lagging its peers.
The Price Relative is used to gauge relative strength, which is important when it comes to stock selection. Many portfolio managers compare their performance to a benchmark, such as the S&P 500. Their goal is to outperform that benchmark. In order to achieve this goal, managers often look for stocks that are showing relative strength. Enter the Price Relative. The Price Relative rises when a stock shows relative strength and is outperforming its benchmark. Conversely, the Price Relative falls when a stock shows relative weakness and is underperforming its benchmark.
Source: https://school.stockcharts.com/doku.php?id=technical_indicators%3Aprice_relative
This script allows the user to
- Add a new indicator pane for Price Relative (PR)
- Edit the benchmark symbol (Comparative Symbol)
- Edit or hide the moving average
- Quickly determine if the symbol is outperforming or underperforming its benchmark
- Quickly determine if the symbols is trending higher or lower based on a simple moving average
Skrip sumber terbuka
Dalam semangat TradingView sebenar, pencipta skrip ini telah menjadikannya sumber terbuka, jadi pedagang boleh menilai dan mengesahkan kefungsiannya. Terima kasih kepada penulis! Walaupuan anda boleh menggunakan secara percuma, ingat bahawa penerbitan semula kod ini tertakluk kepada Peraturan Dalaman.
Penafian
Maklumat dan penerbitan adalah tidak bertujuan, dan tidak membentuk, nasihat atau cadangan kewangan, pelaburan, dagangan atau jenis lain yang diberikan atau disahkan oleh TradingView. Baca lebih dalam Terma Penggunaan.