OPEN-SOURCE SCRIPT
Telah dikemas kini Pivots MTF [LucF]
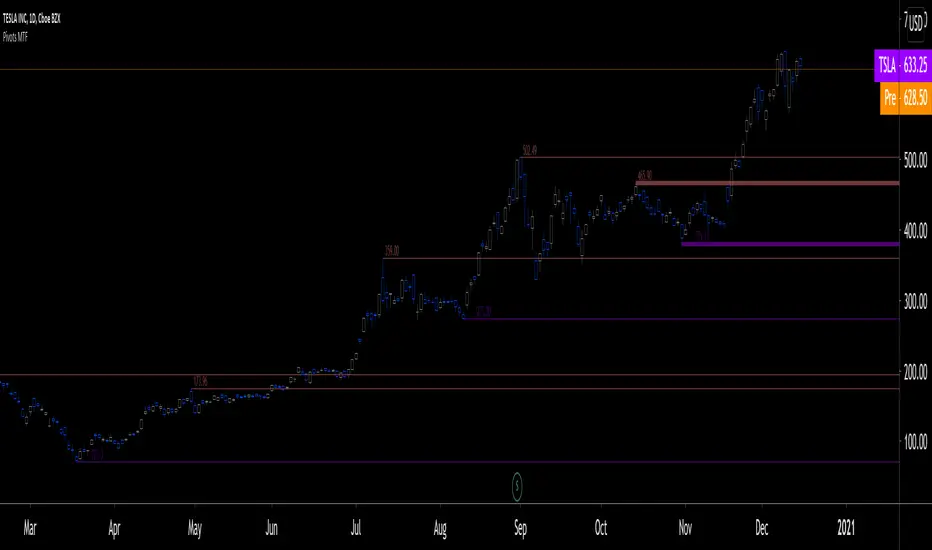
Pivots detected at higher timeframes are more significant because more market activity—or work—is required to produce them. This indicator displays pivots calculated on the higher timeframe of your choice.
Features
► Timeframe selection
— The higher timeframe (HTF) can be selected in 3 different ways:
• By steps (15 min., 60 min., 4H, 1D, 3D, 1W, 1M, 1Y). This setting is the default.
• As a multiple of the current chart's resolution, which can be fractional, so 3.5 will work.
• Fixed.
— The HTF used can be displayed near the last bar (default).
— Note that using the HTF is not mandatory. If it is disabled, the indicator will calculate on the chart's resolution.
— Non-repainting or repainting mode can be selected. This has no impact on the display of historical bars, but when no repainting is selected, pivot detection in the realtime bar will be delayed by one chart bar (not one bar at the HTF).
► Pivots
— Three color schemes are provided: green/red, aqua/pink and coral/violet (the default).
— Both the thickness and brightness of lines can be controlled separately for the hi and lo pivots.
— The visibility of the last hi/lo pivots can be enhanced.
— Prices can be displayed on pivot lines and the text's size and color can be adjusted.
— The number of bars required for the left/right pivot legs can be controlled (the default is 4).
— The source can be selected individually for hi and lo pivots (the default is hlc3 and low.
— The mean of the hi/lo pivot values of the last few thousand chart bars can be displayed. Pivots having lasted longer during the mean's period will weigh more in the calculation. The mean can be displayed in running mode and/or only showing its last level as a long horizontal line. I don't find it very useful; maybe others will.
► Markers and Alerts
— Markers can be configured on breaches of either the last hi/lo pivot levels, or the hi/lo mean. Crossovers and crossunders are controlled separately.
— Alerts can be configured using any of the marker combinations. As is usual for my indicators, only one alert is used. It will trigger on the markers that are active when you create your alert. Once your markers are set up the way you want, create your alert from the chart/timeframe you want the alert to run on, and be sure to use the “Once Per Bar Close” triggering condition. Use an alert message that will remind you of the combination of markers used when creating the alert. If you use multiple markers to trigger one alert, then having the indicator show those markers will be important to help you figure out which marker triggered the alert when it fired.
A quick look at the pattern of these markers will hopefully convince you that using them as entry/exit signals would be perilous, as they are prone to whipsaw. I have included them because some traders may use the markers as reminders.
Using Pivots
These pivots can be used in a few different ways:
— When using the high/low sources they will show extreme levels, breaches of which should be more significant.
— Another way to use them is with hlc3 (the average of the high, low and close) for hi pivots and low for the lo pivots. This accounts for my personal mythology to the effect that drops typically reach previous lows more easily than rallies make newer highs.
— Using low for hi pivots and high for lo pivots (so backward) can be a useful way to set stops or to detect weakness in movements.
You will usually be better served by pivots if you consider them as denoting regions rather than precise levels. The flexibility in the display options of this indicator will help you adapt it to the way you use your pivots. To indicate areas rather than levels, for example, try using a brightness of 1 with a line thickness of 30. The cloud effect generated this way will show areas better than fine lines.
Realize that these pivot lines are positioned in the past, and so they are drawn after the fact because a given number of bars need to elapse before calculations determine a pivot has occurred. You will thus never see a pivot top, for example, identified on the realtime bar. To detect a pivot, it takes a number of bars corresponding to the dilation of the higher timeframe in the current one, multiplied by the number of bars you use for your pivots' right leg. Also note that the Pine native function used to detect pivots in this indicator considers a summit to be a top when the number of bars in each leg are lower or equal to that top. Bars in legs do not need to be progressively lower on each side of the pivot for a pivot to be detected.
If you program in Pine
— See the Pinecoders MTF Selection Framework for an explanation of the functions used in this script to provide the selection mechanism for the higher timeframe.
— This code uses the Pine Script Coding Conventions.
Thanks
— To the Pine coders asking questions in the Pine Script chat on TV; your questions got me to write this indicator.
Nota Keluaran
Aesthetic changes in code )Nota Keluaran
.• You can now define the number of last pivots to display.
• Price values display with tick precision.
• The mean or median of the number of pivots displayed can be plotted as a running value. You can also highlight the last value.
• Pivot crosses detect a cross of any of the last n pivots displayed.
Skrip sumber terbuka
Dalam semangat sebenar TradingView, pencipta skrip ini telah menjadikannya sumber terbuka supaya pedagang dapat menilai dan mengesahkan kefungsiannya. Terima kasih kepada penulis! Walaupun anda boleh menggunakannya secara percuma, ingat bahawa menerbitkan semula kod ini adalah tertakluk kepada Peraturan Dalaman kami.
"The stock market is a device for transferring money from the impatient to the patient."
— Buffet
tradingview.com/u/PineCoders/
tradingview.com/u/TradingView/
— Buffet
tradingview.com/u/PineCoders/
tradingview.com/u/TradingView/
Penafian
Maklumat dan penerbitan adalah tidak dimaksudkan untuk menjadi, dan tidak membentuk, nasihat untuk kewangan, pelaburan, perdagangan dan jenis-jenis lain atau cadangan yang dibekalkan atau disahkan oleh TradingView. Baca dengan lebih lanjut di Terma Penggunaan.