PROTECTED SOURCE SCRIPT
Telah dikemas kini AI Strat ATR Dinamico + ADX + Trend Adaptivo (No Repaint)
Below is a fully self-contained, English-language description of every input, function, and logical block inside the “AI Strat ATR Dinamico + ADX + Trend Adaptivo (No Repaint)” indicator. You can copy and paste this into TradingView’s “Description” field when you publish, without exposing any Pine code.
---
## Indicator Name and Purpose
**Name (Short Title):**
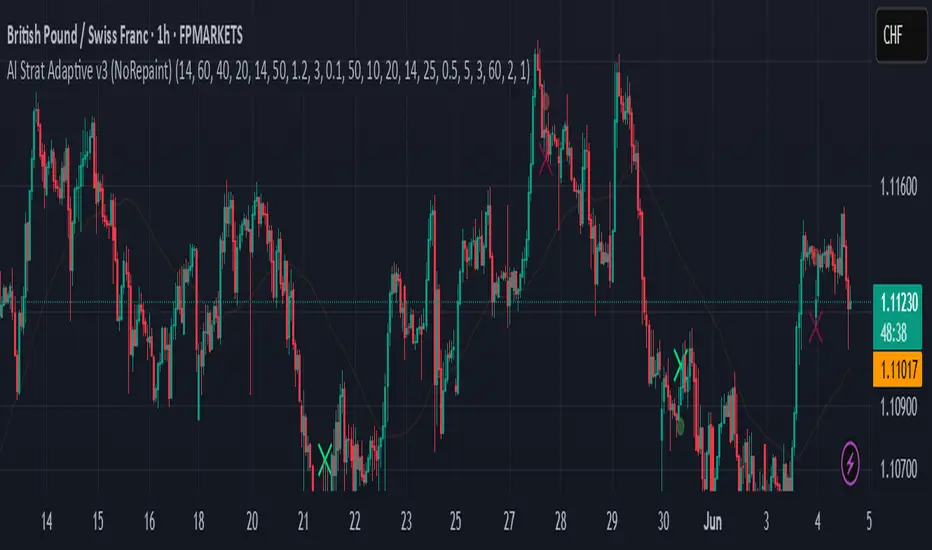
AI Strat Adaptive v3 (NoRepaint)
**Overview:**
This indicator combines multiple technical tools—RSI, EMA, ATR (with a dynamic multiplier), ADX/DI, and an “AI‐style” scoring mechanism—to generate trend-filtered and reversal signals. It also optionally confirms signals on a higher timeframe, dynamically adjusts its sensitivity based on volatility, and plots intrabar stop‐loss (SL) and take‐profit (TP) levels derived from ATR. Special care has been taken to ensure that no signals “repaint” (i.e., once drawn on a closed bar, they never disappear or shift).
---
## 1. Main Inputs
All of the inputs appear in the Settings dialog for the published indicator. Below is a detailed explanation of each input, grouped by logical category.
### A. RSI & EMA Base Parameters
1. **RSI Length (Base)**
* **Input type:** Integer (default 14)
* **Description:** Number of bars used to calculate the Relative Strength Index (RSI). A shorter RSI reacts more quickly to price changes; a longer RSI is smoother.
2. **RSI Overbought Threshold**
* **Input type:** Integer (default 60)
* **Description:** If the RSI value rises above this level, it contributes a “sell” signal component. You can adjust this (e.g., 70) to make your system more conservative.
3. **RSI Oversold Threshold**
* **Input type:** Integer (default 40)
* **Description:** If the RSI falls below this level, it contributes a “buy” signal component. Raising this threshold (e.g., 50) makes the strategy more aggressive in seeking reversals.
4. **EMA Length (Base)**
* **Input type:** Integer (default 20)
* **Description:** Number of bars for the Exponential Moving Average (EMA). A shorter EMA will produce more frequent crossovers, a longer EMA is smoother.
### B. ATR & Volatility Filter Parameters
5. **ATR Length (Base)**
* **Input type:** Integer (default 14)
* **Description:** Number of bars to calculate Average True Range (ATR). The ATR is used both for measuring volatility and for dynamic SL/TP levels.
6. **ATR SMA Length**
* **Input type:** Integer (default 50)
* **Description:** Number of bars to compute a Simple Moving Average of the ATR itself. This gives a baseline of “normal” volatility. If ATR rises significantly above this SMA, the indicator treats the market as “high volatility.”
7. **ATR Multiplier Base**
* **Input type:** Float (default 1.2, step 0.1)
* **Description:** Base multiplier for ATR when filtering for volatility. The actual threshold is computed as `ATR_SMA × (ATR_Multiplier Base) × sqrt(current_ATR / ATR_SMA)`. In other words, the multiplier becomes larger if volatility is rising, and smaller if volatility is falling.
8. **Disable Volatility Filter**
* **Input type:** Boolean (default false)
* **Description:** If enabled (true), the indicator will ignore any volatility‐based filtering, using signals regardless of ATR behavior. If disabled (false), signals only fire when ATR > (ATR\_SMA × dynamic multiplier).
### C. Price-Change & “AI Score” Parameters
9. **Price Change Period (bars)**
* **Input type:** Integer (default 3)
* **Description:** The number of bars back to measure percentage price change. Used to ensure that a “trend” signal is accompanied by a sufficiently positive (for longs) or negative (for shorts) price movement over this many bars.
10. **Base AI Score Threshold**
* **Input type:** Float (default 0.1)
* **Description:** The indicator computes a composite “AI-style” score by combining the RSI signal (overbought/oversold) and an EMA crossover signal. Only if the absolute value of that composite score exceeds this threshold will a trend signal be eligible. Raising it makes signals rarer but (potentially) higher-conviction.
### D. SMA “ICT” Trend Filter Parameters
11. **ICT SMA Long Length (Base)**
* **Input type:** Integer (default 50)
* **Description:** Number of bars for the “long” Simple Moving Average (SMA) used in the internal trend filter. Typically, price must be above this SMA (and ADX must be strong) to confirm an uptrend, or below it (and ADX strong) to confirm a downtrend.
12. **ICT SMA Short1 Length (Base)**
* **Input type:** Integer (default 10)
* **Description:** Secondary “fast” SMA used both for reversal logic (e.g., price crossing above it can count as a bullish reversal) and part of the internal trend confirmation.
13. **ICT SMA Short2 Length (Base)**
* **Input type:** Integer (default 20)
* **Description:** A second “medium” SMA used for reversal triggers (e.g., crossovers or crossunders alongside RSI conditions).
### E. ADX & DI Parameters
14. **Base ADX Length**
* **Input type:** Integer (default 14)
* **Description:** Number of bars for the ADX (Average Directional Index) moving averages, which measure trend strength. The same length is used for +DI and –DI smoothing.
15. **Base ADX Threshold**
* **Input type:** Float (default 25.0, step 0.5)
* **Description:** If ADX > this threshold and +DI > –DI, we consider an uptrend; if ADX > this threshold and –DI > +DI, we consider a downtrend. Raising this value demands stronger trends to qualify.
### F. Sensitivity & Cooldown
16. **Sensitivity (0–1)**
* **Input type:** Float between 0.0 and 1.0 (default 0.5)
* **Description:** A general “mixture” parameter used internally to weight how aggressively the indicator leans into trend versus reversal. In practice, the code uses it to fine-tune exact thresholds for switching between trend and reversal conditions. You can leave it at 0.5 unless you want to bias more heavily toward either regime.
17. **Base Cooldown Bars Between Signals**
* **Input type:** Integer (default 5, min 0)
* **Description:** Once a long or short signal fires, the indicator will wait at least this many bars before allowing a new signal in the same direction. Prevents “signal flipping” on each bar. A higher number forces fewer, more spaced-out entries.
18. **Trend Confirmation Bars**
* **Input type:** Integer (default 3, min 1)
* **Description:** After the directional filters (+DI/–DI cross, price vs. SMA), the indicator still requires that price remains on the same side of the long SMA for at least this many consecutive bars before confirming “trend up” or “trend down.” Larger values smooth out false breakouts but may lag signals.
### G. Higher Timeframe Confirmation
19. **Use Higher Timeframe Confirmation**
* **Input type:** Boolean (default true)
* **Description:** If true, the indicator will request a block of values (SMA, +DI, –DI, ADX) from a higher timeframe (default 60 minutes) and require that the higher timeframe is also in agreement (strong uptrend or strong downtrend) before confirming your current-timeframe trend. This helps filter out lower-timeframe noise.
20. **Higher Timeframe (TF) for Confirmation**
* **Input type:** Timeframe (default “60”)
* **Description:** The chart timeframe (e.g., 5, 15, 60 minutes) whose trend conditions must also be true. It’s sent through a `request.security(..., lookahead=barmerge.lookahead_off)` call so that it never “paints ahead.”
### H. Dynamic TP/SL Parameters
21. **TP as ATR Multiple**
* **Input type:** Float (default 2.0, step 0.1)
* **Description:** When a trade is open, the “take-profit” price is determined by looking at the highest high (for longs) or lowest low (for shorts) observed since entry, and then plotting a cross (“X”) at that level when the trend finally flips. This is purely for display. However, separate from that, this parameter can be adapted if you want a strictly ATR–based TP. In the “Minimal” version, TP is ≈ (highest high) once trend inverts, but you could rewrite it to use `entry_price + ATR×TP_Multiplier`.
22. **SL as ATR Multiple**
* **Input type:** Float (default 1.0, step 0.1)
* **Description:** While in a trade, a trailing SL line is plotted each bar. Its value is always `entry_price ± (ATR × SL_Multiplier)`. When the trend inverts, the SL no longer updates, and you see it on the chart.
### I. Display and Mode Options
23. **Show Debug Lines**
* **Input type:** Boolean (default true)
* **Description:** When enabled, the indicator will plot all intermediate lines—ATR SMA, ATR Threshold, +DI, –DI, ADX (current and HTF), HTF SMA, etc.—so that you can diagnose exactly what’s happening. Turn this off to hide all debug information and only see entry/exit shapes.
24. **Enable Scalping Mode**
* **Input type:** Boolean (default false)
* **Description:** If true, many of the “base” parameters are halved (e.g., RSI length becomes 7 instead of 14, ATR length becomes 7 instead of 14, ADX length becomes 7, etc.), and the ADX threshold is multiplied by 0.8. This makes all oscillators and moving averages more reactive, suited for very short-term (scalping) setups.
---
## 2. Core Calculation Blocks
Below is a high-level description of each logical block (in code order), translated from Pine into conceptual steps.
### A. Adjust Inputs if “Scalping Mode” Is On
If **Scalping Mode** = true, then:
* `RSI_Length` becomes `max(1, round(Base_RSI_Length / 2))`
* `EMA_Length` becomes `max(1, round(Base_EMA_Length / 2))`
* `ATR_Length` becomes `max(1, round(Base_ATR_Length / 2))`
* `Price_Change_Period` becomes `max(1, round(Base_Price_Change_Period / 2))`
* `SMA_Long_Length`, `SMA_Short1_Length`, and `SMA_Short2_Length` are each halved (minimum 1).
* `ADX_Length` = `max(1, round(Base_ADX_Length / 2))`
* `ADX_Threshold` = `Base_ADX_Threshold × 0.8`
* `Cooldown_Bars` = `max(0, round(Base_Cooldown_Bars / 2))`
Otherwise, all adjusted lengths = their base values.
### B. RSI, EMA & “AI Score” on Current Timeframe
1. **Compute RSI:**
* Uses the (possibly adjusted) `RSI_Length`.
* Denote this as `RSI_Value`.
2. **Compute ATR & Its SMA:**
* `ATR_Value` = `ta.atr(ATR_Length)`.
* `ATR_SMA` = `ta.sma(ATR_Value, ATR_SMA_Length)`.
* Then define `Volatility_Increase` = (`ATR_Value > ATR_SMA`).
* If the volatility has increased, the weighting of RSI vs. EMA changes.
3. **Compute Weights:**
* If `Volatility_Increase == true`, then:
* `RSI_Weight = 0.7`
* `EMA_Weight = 0.3`
* Otherwise:
* `RSI_Weight = 0.3`
* `EMA_Weight = 0.7`
4. **RSI Signal Component (`RSI_Sig`):**
* If `RSI_Value > RSI_Overbought`, then `RSI_Sig = –1`.
* Else if `RSI_Value < RSI_Oversold`, then `RSI_Sig = +1`.
* Otherwise, `RSI_Sig = 0`.
5. **EMA Value & Signal Component (`EMA_Sig`):**
* `EMA_Value` = `ta.ema(close, EMA_Length)`.
* `EMA_Sig = +1` if the current close crosses **above** the EMA; `EMA_Sig = –1` if the current close crosses **below** the EMA; else `0`.
6. **Compute Raw “AI Score”:**
$$
Raw\_AI = (RSI\_Sig \times RSI\_Weight)\;+\;(EMA\_Sig \times EMA\_Weight)
$$
Then,
$$
AI\_Score = \frac{Raw\_AI}{(RSI\_Weight + EMA\_Weight)}
$$
(This normalization ensures the score always ranges between –1 and +1 if both weights sum to 1.)
### C. Dynamic ATR Multiplier & Volatility Filter
1. **Volatility Factor:**
$$
Volatility\_Factor = \frac{ATR\_Value}{ATR\_SMA}
$$
2. **Dynamic ATR Multiplier:**
$$
ATR\_Multiplier = ATR\_Multiplier\_Base \times \sqrt{Volatility\_Factor}
$$
3. **High Volatility Condition (`High_Volatility`):**
* If `Disable_Volatility_Filter == true`, then treat `High_Volatility = true` always.
* Else, `High_Volatility = (ATR_Value > ATR_SMA × ATR_Multiplier)`.
### D. Price Change Percentage
* **Compute Price Change:**
$$
Price\_Change = \frac{(Close - Close[Price\_Change\_Period])}{Close[Price\_Change\_Period]} \times 100
$$
* This is the percent return from `Price_Change_Period` bars ago to now.
* For a valid long‐trend signal, we require `Price_Change > 0`; for a short trend, `Price_Change < 0`.
### E. Local SMAs for Trend/Reversal Filters
* `SMA_Close_Long` = `ta.sma(close, SMA_Long_Length)`.
* `SMA_Close_Short1` = `ta.sma(close, SMA_Short1_Length)`.
* `SMA_Close_Short2` = `ta.sma(close, SMA_Short2_Length)`.
These three SMAs help define the “local trend” and reversal breakout points:
* **Primary Trend Filter:**
* Price must be above `SMA_Close_Long` for an uptrend filter, or below `SMA_Close_Long` for a downtrend filter.
* **Reversal Filter:**
* A bullish reversal is detected if **(RSI < Oversold AND close crosses above EMA)** OR **(RSI < Oversold AND close crosses above SMA\_Close\_Short1)**.
* A bearish reversal is detected if **(RSI > Overbought AND close crosses below EMA)** OR **(RSI > Overbought AND close crosses below SMA\_Close\_Short1)**.
### F. Manual +DI, –DI & ADX on Current Timeframe
Instead of relying on the built-in `ta.adx`, the script calculates DI and ADX manually. This makes it easier to replicate the exact logic on a higher timeframe via `request.security`. The steps are:
1. **Directional Movement (DM) Components:**
* `Up_Move` = `high – high[1]`
* `Down_Move` = `low[1] – low`
* `Plus_DM` = `Up_Move` if (`Up_Move > Down_Move` AND `Up_Move > 0`), else `0`
* `Minus_DM` = `Down_Move` if (`Down_Move > Up_Move` AND `Down_Move > 0`), else `0`
2. **True Range (TR) Components:**
* `TR1` = `high – low`
* `TR2` = `abs(high – close[1])`
* `TR3` = `abs(low – close[1])`
* `True_Range` = `max(TR1, TR2, TR3)`
3. **Smoothed Averages (RMA):**
* `Sm_TR` = `ta.rma(True_Range, ADX_Length)`
* `Sm_Plus` = `ta.rma(Plus_DM, ADX_Length)`
* `Sm_Minus`= `ta.rma(Minus_DM, ADX_Length)`
4. **Compute DI%:**
$$
Plus\_DI = \frac{Sm\_Plus}{Sm\_TR} \times 100,\quad
Minus\_DI = \frac{Sm\_Minus}{Sm\_TR} \times 100
$$
5. **DX and ADX:**
$$
DX = \frac{|Plus\_DI - Minus\_DI|}{Plus\_DI + Minus\_DI} \times 100,\quad
ADX = ta.rma(DX, ADX_Length)
$$
These values are referred to as `(plus_di, minus_di, adx_val)` for the current timeframe.
---
## 3. Higher Timeframe (HTF) Confirmation Function
If **Use Higher Timeframe Confirmation** is enabled, the script calls a single helper (Pine) function `f_htf` with two parameters: the ADX length and the SMA length (both taken from the “base” or “scaled” values). Internally, `f_htf` simply reruns the manual DI/ADX logic (same as above) on the higher timeframe’s bar data, and also includes that timeframe’s closing price and its SMA for trend comparison.
* **Request.Security Call:**
```
[ht_close, ht_sma, ht_pdi, ht_mdi, ht_adx] = request.security(
syminfo.tickerid,
higher_tf,
f_htf(adx_length, sma_long_len),
lookahead=barmerge.lookahead_off
)
```
* `lookahead=barmerge.lookahead_off` ensures that no HTF value “paints” early; you always see only confirmed HTF bars.
* The returned tuple provides:
1. `ht_close` = HTF closing price
2. `ht_sma` = HTF SMA of length `sma_long_len`
3. `ht_pdi` = HTF +DI percentage
4. `ht_mdi` = HTF –DI percentage
5. `ht_adx` = HTF ADX value
---
## 4. Trend & Reversal Filters (Current & HTF)
### A. Current-Timeframe Trend Filter
1. **Uptrend\_Basic (Current TF)**
$$
(plus\_di > minus\_di)\;\land\;(adx\_val > ADX\_Threshold)\;\land\;(close > SMA\_Close\_Long)
$$
2. **Downtrend\_Basic (Current TF)**
$$
(minus\_di > plus\_di)\;\land\;(adx\_val > ADX\_Threshold)\;\land\;(close < SMA\_Close\_Long)
$$
3. **Trend Confirmation by Bars:**
* `Bars_Since_Below` = number of bars since `close <= SMA_Close_Long`.
* `Bars_Since_Above` = number of bars since `close >= SMA_Close_Long`.
* If `Uptrend_Basic == true` AND `Bars_Since_Below ≥ Trend_Confirmation_Bars` → mark `Uptrend_Confirm = true`.
* If `Downtrend_Basic == true` AND `Bars_Since_Above ≥ Trend_Confirmation_Bars` → mark `Downtrend_Confirm = true`.
### B. Reversal Filters (Current TF)
1. **Bullish Reversal (`Rev_Bullish`):**
* If `(RSI < RSI_Oversold AND close crosses above EMA_Value)` OR
`(RSI < RSI_Oversold AND close crosses above SMA_Close_Short1)`
→ then `Rev_Bullish = true`.
2. **Bearish Reversal (`Rev_Bearish`):**
* If `(RSI > RSI_Overbought AND close crosses below EMA_Value)` OR
`(RSI > RSI_Overbought AND close crosses below SMA_Close_Short1)`
→ then `Rev_Bearish = true`.
### C. Higher-Timeframe Trend Filter (HTF)
1. **HTF Uptrend (`HT_Uptrend`):**
$$
(ht\_pdi > ht\_mdi)\;\land\;(ht\_adx > ADX\_Threshold)\;\land\;(ht\_close > ht\_sma)
$$
2. **HTF Downtrend (`HT_Downtrend`):**
$$
(ht\_mdi > ht\_pdi)\;\land\;(ht\_adx > ADX\_Threshold)\;\land\;(ht\_close < ht\_sma)
$$
3. **Combine Current & HTF:**
* If **Use\_HTF\_Confirmation == true**, then:
* `Uptrend_Confirm := Uptrend_Confirm AND HT_Uptrend`
* `Downtrend_Confirm := Downtrend_Confirm AND HT_Downtrend`
* Otherwise, just use the current timeframe’s `Uptrend_Confirm` and `Downtrend_Confirm`.
4. **Define `CurrentTrend` (Integer):**
* `CurrentTrend = +1` if `Uptrend_Confirm == true`.
* `CurrentTrend = –1` if `Downtrend_Confirm == true`.
* Otherwise, `CurrentTrend = 0`.
5. **Reset “One Trade Per Trend”:**
* There is a persistent variable `LastTradeTrend`.
* Every time `CurrentTrend` flips (i.e., `CurrentTrend != CurrentTrend[1]`), the code sets `LastTradeTrend := 0`.
* That allows one new entry once the detected trend has changed.
---
## 5. One‐Time “Cooldown” Logic
* **`LastSignalBar`**
* A persistent integer (initially undefined).
* After each confirmed long or short entry, `LastSignalBar` is set to the bar index where that signal fired.
* **`Bars_Since_Signal`**
* If `LastSignalBar` is undefined, treat as a very large number (so that initial signals are always allowed).
* Otherwise, `Bars_Since_Signal = bar_index – LastSignalBar`.
* **Cooldown Check:**
* A new long (or short) can only be generated if `(Bars_Since_Signal > Signal_Cooldown)`.
* This prevents multiple signals in rapid succession.
---
## 6. Entry Conditions (No Repaint)
All of the conditions below are calculated “intrabar,” but the script only actually registers a **signal** on **bar close** (`barstate.isconfirmed`) so that signals never repaint.
### A. Trend‐Based “Raw” Conditions
1. **Trend\_Long\_Raw:**
$$
(AI\_Score > AI\_Score\_Threshold)\;\land\;Uptrend\_Confirm\;\land\;High\_Volatility\;\land\;(Price\_Change > 0)
$$
2. **Trend\_Short\_Raw:**
$$
(AI\_Score < -AI\_Score\_Threshold)\;\land\;Downtrend\_Confirm\;\land\;High\_Volatility\;\land\;(Price\_Change < 0)
$$
### B. Reversal “Raw” Conditions
1. **Rev\_Long\_Raw:**
$$
Rev\_Bullish\;\land\;(CurrentTrend \neq +1)
$$
2. **Rev\_Short\_Raw:**
$$
Rev\_Bearish\;\land\;(CurrentTrend \neq -1)
$$
### C. Combine Raw Signals
* `Raw_Long = Trend_Long_Raw OR Rev_Long_Raw`.
* `Raw_Short = Trend_Short_Raw OR Rev_Short_Raw`.
### D. Confirmed Long/Short Signal Flags
On each new bar **close** (`barstate.isconfirmed == true`):
* **Long\_Signal\_Confirmed** can fire if:
1. `Raw_Long == true`
2. `LastTradeTrend != +1` (we haven’t already taken a long in this same trend)
3. `Bars_Since_Signal > Signal_Cooldown`
If all three hold, then on this bar close the code sets:
* `Long_Signal = true`
* `LastTradeTrend := +1`
* `LastSignalBar := bar_index`
Otherwise, `Long_Signal := false` on this bar.
* **Short\_Signal\_Confirmed** works the same way but with `Raw_Short`, `LastTradeTrend != -1`, etc.
If triggered, it sets `Short_Signal = true`, `LastTradeTrend := -1`, and `LastSignalBar := bar_index`. Otherwise `Short_Signal := false`.
* **Important:** If the bar is still forming (`else` branch of `barstate.isconfirmed`), then both `Long_Signal` and `Short_Signal` are forced to `false`. This guarantees that no shape or alert appears until the bar actually closes.
---
## 7. Plotting Entry/Exit Shapes
1. **Trend Long Signal (Triangle Up)**
* Condition: `Long_Signal == true` **AND** `Trend_Long_Raw == true`.
* Appearance: A small, semi-transparent lime green triangle drawn **below** the bar.
2. **Trend Short Signal (Triangle Down)**
* Condition: `Short_Signal == true` **AND** `Trend_Short_Raw == true`.
* Appearance: A small, semi-transparent maroon triangle drawn **above** the bar.
3. **Reversal Long Signal (Circle)**
* Condition: `Long_Signal == true` **AND** `Rev_Long_Raw == true`.
* Appearance: A tiny, more transparent green circle drawn **below** the bar.
4. **Reversal Short Signal (Circle)**
* Condition: `Short_Signal == true` **AND** `Rev_Short_Raw == true`.
* Appearance: A tiny, more transparent red circle drawn **above** the bar.
Since `Long_Signal` and `Short_Signal` only ever become true at bar close, these shapes are never repainted or removed once drawn.
---
## 8. Unified Alert Message
* As soon as a new bar closes with either `Long_Signal` or `Short_Signal == true`, an alert message is sent:
* If `Long_Signal`, then `alert_msg = "action=BUY"`.
* If `Short_Signal`, then `alert_msg = "action=SELL"`.
* If neither, `alert_msg = ""` (no alert).
* The code calls `alert(alert_msg, freq=alert.freq_once_per_bar)` only if `barstate.isconfirmed` and `alert_msg` is non‐empty. This ensures exactly one alert per confirmed bar, no intrabar pops.
---
## 9. Dynamic TP/SL Logic (Minimal Implementation)
Once a long or short position is “open,” the script tracks these variables:
1. **Persistent Flags and Prices** (all persist between bars until reset):
* `InLong` (Boolean)
* `InShort` (Boolean)
* `Long_Max` (Float)
* `Short_Min` (Float)
* `Entry_Price` (Float)
2. **On Bar Close:**
* If `Long_Signal == true` →
* Set `InLong := true`,
* `Entry_Price := close` of that bar,
* `Long_Max := high[1]` (last bar’s high, so that we’re not using “future” data).
* If `Short_Signal == true` →
* Set `InShort := true`,
* `Entry_Price := close`,
* `Short_Min := low[1]`.
3. **While `InLong == true`:**
* Continuously update `Long_Max = max(Long_Max, current high)` on each bar (intrabar, but finalized each close).
* Compute a dynamic SL:
$$
SL_{Long} = Entry\_Price - (ATR \times SL\_ATR\_Multiplier).
$$
* If **current trend** flips to non-uptrend (`CurrentTrend != +1`), mark `ExitLong = true`.
* Then the routine plots `TP_Long = Long_Max` as a cross (“X”) at that level.
* Set `InLong := false` so that no further changes to `Long_Max` or `Entry_Price` happen on future bars.
4. **While `InShort == true`:**
* Continuously update `Short_Min = min(Short_Min, current low)`.
* Compute a dynamic SL:
$$
SL_{Short} = Entry\_Price + (ATR \times SL\_ATR\_Multiplier).
$$
* If trend flips to non-downtrend (`CurrentTrend != –1`), mark `ExitShort = true`.
* Then the routine plots `TP_Short = Short_Min`.
* Set `InShort := false` to freeze those values.
5. **Plotting TP/SL if “Show Debug” is On:**
* **TP Shapes:**
* When `ExitLong == true`, plot a solid lime “X” at `TP_Long` (highest high).
* When `ExitShort == true`, plot a solid maroon “X” at `TP_Short` (lowest low).
* **SL Lines:**
* If still `InLong`, draw a thin red line at `SL_Long` on each bar.
* If still `InShort`, draw a thin green line at `SL_Short`.
Thus, your charts visually show the highest‐high take-profit cross for longs, the lowest-low take-profit cross for shorts, and a continuously updating trailing SL until the trend flips. Because all of this is triggered on confirmed bars, nothing “jumps around” after the fact.
---
## 10. Debug‐Only Plot Lines (When Enabled)
When **Show Debug Lines** = true, the indicator will also plot:
1. **ATR SMA (Orange):**
* The simple moving average of ATR over `ATR_SMA_Length`.
2. **ATR Threshold (Yellow):**
* `ATR_SMA × ATR_Multiplier` (the dynamically scaled threshold).
3. **+DI & –DI (Current TF):**
* +DI plotted as a green line, –DI plotted as a red line (opacity \~70%).
4. **ADX (Current TF, Blue):**
* A blue line for the present timeframe’s ADX.
5. **ADX Threshold (Gray):**
* A horizontal gray line showing `ADX_Threshold`.
6. **+DI & –DI (HTF, Darker Colors):**
* If HTF confirmation is on, “HTF +DI” is a greener but more transparent line; “HTF –DI” is a redder but more transparent line.
7. **ADX (HTF, Blue but Transparent):**
* HTF ADX plotted in blue (high transparency).
8. **HTF SMA (Orange, Transparent):**
* The higher timeframe’s SMA (same length as `SMA_Long_Length`), drawn in fainter orange.
9. **Volatility Zone Fill (Yellow Tinted Area):**
* Fills the area between `ATR_SMA` and `ATR_SMA × ATR_Multiplier`.
* Indicates “normal” versus “high‐volatility” regimes.
These debug lines are purely visual aids. Disable them if you want a cleaner chart.
---
## 11. Putting It All Together — Step-By-Step Flow
1. **Read Inputs** (RSI lengths, EMA length, ATR settings, etc.).
2. **Optionally Halve All Lengths** if “Scalping Mode” is checked.
3. **Calculate Current TF Indicators:**
* RSI, ATR, ATR\_SMA, EMA, price change, various SMAs, DI/ADX.
4. **Compute “AI Score”** (weighted sum of RSI and EMA signals).
5. **Compute Dynamic ATR Multiplier** and decide if “High Volatility” is true.
6. **Compute Raw Trend/Reversal Conditions** on the current timeframe (without triggering yet).
7. **Fetch HTF Values** in one `request.security` call (SMAs, DI/ADX).
8. **Combine Current & HTF Trend Filters** to confirm `Uptrend_Confirm` or `Downtrend_Confirm`.
9. **Check Reversal Conditions** (price crossing EMA or SMA short, in overbought/oversold zones).
10. **Enforce “One Trade Per Trend”** (clear `LastTradeTrend` whenever `CurrentTrend` flips).
11. **Enforce Cooldown** (must wait at least `Signal_Cooldown` bars since the prior signal).
12. **On Bar Close:**
* If `Raw_Long` AND not already in a long trend AND cooldown met, then fire `Long_Signal`.
* Else if `Raw_Short` AND not already in a short trend AND cooldown met, then fire `Short_Signal`.
* Otherwise, no new signal on this bar.
13. **Plot Long/Short Entry Shapes** according to whether it was a Trend signal or a Reversal signal.
14. **Send Alert** (“action=BUY” or “action=SELL”) exactly once per confirmed bar.
15. **If New Long/Short Signal, Set `InLong`/`InShort`, Record Entry Price, Initialize `Long_Max`/`Short_Min`.**
16. **While `InLong` is true:** Update `Long_Max = max(previous Long_Max, current high)`. Compute `SL_Long`. If the current trend flips (no longer uptrend), set `ExitLong = true`, plot a “TP X,” and close the position logic.
17. **While `InShort` is true:** Similarly update `Short_Min`, compute `SL_Short`, and if trend flips, set `ExitShort = true`, plot a “TP X,” and close the position logic.
18. **Optionally Display Debug Lines** (ATR SMA, ATR threshold, DI/ADX, HTF DI/ADX, etc.).
---
## 12. How to Use in TradingView Community
When you publish this indicator to the TradingView community—choosing “Protected” or “Invite-only” visibility—you can paste the above description into the “Description” field. Users will see exactly what each input does, how signals are generated, and what the various plotted lines represent, **without ever seeing the script source**. In this way, the code itself remains hidden but the logic is fully documented.
1. **Go to “Create New Indicator”** on TradingView.
2. **Paste Your Pine Code** (the full indicator script) in the Pine editor and save it.
3. **Set Visibility = Protected** (or Invite-only).
4. **In the “Description” Text Box, paste the entirety of this document** (steps 1–11).
5. **Click “Publish Script.”**
Users who view your indicator will see its name (“AI Strat Adaptive v3 (NoRepaint)”), a list of all inputs (with default values), and the detailed English description above. They can then load it on any chart, adjust inputs, and see the plotted signals, TP/SL lines, and optional debug overlays—without accessing the underlying Pine code.
---
### Summary of Key Points
* **RSI, EMA, ATR, DI/ADX, and “AI Score”** work together to define “trend vs. reversal.”
* **Dynamic volatility filter** uses ATR and ATR\_SMA to adapt the weighting of RSI vs. EMA and decide whether “volatility is high enough” to permit a trend trade.
* **One trade per detected trend** and a **cooldown period** prevent over‐trading.
* **Higher timeframe confirmation** (optional) further filters out noise.
* **No-repaint logic**:
* All signals only appear at bar close (`barstate.isconfirmed`).
* HTF values are fetched with `lookahead=barmerge.lookahead_off`.
* **Entry shapes** (triangles and circles) clearly mark trend vs. reversal entries.
* **Dynamic TP/SL**: highest‐high (or lowest‐low) since entry is used as TP, ATR×multiplier as SL.
* **Debug mode** (optional) shows every intermediate line for full transparency.
Use this description verbatim (or adapt it slightly for your personal style) when publishing. That way, your community sees exactly how each component works—inputs, functions, filters—while the Pine source code remains private.
---
## Indicator Name and Purpose
**Name (Short Title):**
AI Strat Adaptive v3 (NoRepaint)
**Overview:**
This indicator combines multiple technical tools—RSI, EMA, ATR (with a dynamic multiplier), ADX/DI, and an “AI‐style” scoring mechanism—to generate trend-filtered and reversal signals. It also optionally confirms signals on a higher timeframe, dynamically adjusts its sensitivity based on volatility, and plots intrabar stop‐loss (SL) and take‐profit (TP) levels derived from ATR. Special care has been taken to ensure that no signals “repaint” (i.e., once drawn on a closed bar, they never disappear or shift).
---
## 1. Main Inputs
All of the inputs appear in the Settings dialog for the published indicator. Below is a detailed explanation of each input, grouped by logical category.
### A. RSI & EMA Base Parameters
1. **RSI Length (Base)**
* **Input type:** Integer (default 14)
* **Description:** Number of bars used to calculate the Relative Strength Index (RSI). A shorter RSI reacts more quickly to price changes; a longer RSI is smoother.
2. **RSI Overbought Threshold**
* **Input type:** Integer (default 60)
* **Description:** If the RSI value rises above this level, it contributes a “sell” signal component. You can adjust this (e.g., 70) to make your system more conservative.
3. **RSI Oversold Threshold**
* **Input type:** Integer (default 40)
* **Description:** If the RSI falls below this level, it contributes a “buy” signal component. Raising this threshold (e.g., 50) makes the strategy more aggressive in seeking reversals.
4. **EMA Length (Base)**
* **Input type:** Integer (default 20)
* **Description:** Number of bars for the Exponential Moving Average (EMA). A shorter EMA will produce more frequent crossovers, a longer EMA is smoother.
### B. ATR & Volatility Filter Parameters
5. **ATR Length (Base)**
* **Input type:** Integer (default 14)
* **Description:** Number of bars to calculate Average True Range (ATR). The ATR is used both for measuring volatility and for dynamic SL/TP levels.
6. **ATR SMA Length**
* **Input type:** Integer (default 50)
* **Description:** Number of bars to compute a Simple Moving Average of the ATR itself. This gives a baseline of “normal” volatility. If ATR rises significantly above this SMA, the indicator treats the market as “high volatility.”
7. **ATR Multiplier Base**
* **Input type:** Float (default 1.2, step 0.1)
* **Description:** Base multiplier for ATR when filtering for volatility. The actual threshold is computed as `ATR_SMA × (ATR_Multiplier Base) × sqrt(current_ATR / ATR_SMA)`. In other words, the multiplier becomes larger if volatility is rising, and smaller if volatility is falling.
8. **Disable Volatility Filter**
* **Input type:** Boolean (default false)
* **Description:** If enabled (true), the indicator will ignore any volatility‐based filtering, using signals regardless of ATR behavior. If disabled (false), signals only fire when ATR > (ATR\_SMA × dynamic multiplier).
### C. Price-Change & “AI Score” Parameters
9. **Price Change Period (bars)**
* **Input type:** Integer (default 3)
* **Description:** The number of bars back to measure percentage price change. Used to ensure that a “trend” signal is accompanied by a sufficiently positive (for longs) or negative (for shorts) price movement over this many bars.
10. **Base AI Score Threshold**
* **Input type:** Float (default 0.1)
* **Description:** The indicator computes a composite “AI-style” score by combining the RSI signal (overbought/oversold) and an EMA crossover signal. Only if the absolute value of that composite score exceeds this threshold will a trend signal be eligible. Raising it makes signals rarer but (potentially) higher-conviction.
### D. SMA “ICT” Trend Filter Parameters
11. **ICT SMA Long Length (Base)**
* **Input type:** Integer (default 50)
* **Description:** Number of bars for the “long” Simple Moving Average (SMA) used in the internal trend filter. Typically, price must be above this SMA (and ADX must be strong) to confirm an uptrend, or below it (and ADX strong) to confirm a downtrend.
12. **ICT SMA Short1 Length (Base)**
* **Input type:** Integer (default 10)
* **Description:** Secondary “fast” SMA used both for reversal logic (e.g., price crossing above it can count as a bullish reversal) and part of the internal trend confirmation.
13. **ICT SMA Short2 Length (Base)**
* **Input type:** Integer (default 20)
* **Description:** A second “medium” SMA used for reversal triggers (e.g., crossovers or crossunders alongside RSI conditions).
### E. ADX & DI Parameters
14. **Base ADX Length**
* **Input type:** Integer (default 14)
* **Description:** Number of bars for the ADX (Average Directional Index) moving averages, which measure trend strength. The same length is used for +DI and –DI smoothing.
15. **Base ADX Threshold**
* **Input type:** Float (default 25.0, step 0.5)
* **Description:** If ADX > this threshold and +DI > –DI, we consider an uptrend; if ADX > this threshold and –DI > +DI, we consider a downtrend. Raising this value demands stronger trends to qualify.
### F. Sensitivity & Cooldown
16. **Sensitivity (0–1)**
* **Input type:** Float between 0.0 and 1.0 (default 0.5)
* **Description:** A general “mixture” parameter used internally to weight how aggressively the indicator leans into trend versus reversal. In practice, the code uses it to fine-tune exact thresholds for switching between trend and reversal conditions. You can leave it at 0.5 unless you want to bias more heavily toward either regime.
17. **Base Cooldown Bars Between Signals**
* **Input type:** Integer (default 5, min 0)
* **Description:** Once a long or short signal fires, the indicator will wait at least this many bars before allowing a new signal in the same direction. Prevents “signal flipping” on each bar. A higher number forces fewer, more spaced-out entries.
18. **Trend Confirmation Bars**
* **Input type:** Integer (default 3, min 1)
* **Description:** After the directional filters (+DI/–DI cross, price vs. SMA), the indicator still requires that price remains on the same side of the long SMA for at least this many consecutive bars before confirming “trend up” or “trend down.” Larger values smooth out false breakouts but may lag signals.
### G. Higher Timeframe Confirmation
19. **Use Higher Timeframe Confirmation**
* **Input type:** Boolean (default true)
* **Description:** If true, the indicator will request a block of values (SMA, +DI, –DI, ADX) from a higher timeframe (default 60 minutes) and require that the higher timeframe is also in agreement (strong uptrend or strong downtrend) before confirming your current-timeframe trend. This helps filter out lower-timeframe noise.
20. **Higher Timeframe (TF) for Confirmation**
* **Input type:** Timeframe (default “60”)
* **Description:** The chart timeframe (e.g., 5, 15, 60 minutes) whose trend conditions must also be true. It’s sent through a `request.security(..., lookahead=barmerge.lookahead_off)` call so that it never “paints ahead.”
### H. Dynamic TP/SL Parameters
21. **TP as ATR Multiple**
* **Input type:** Float (default 2.0, step 0.1)
* **Description:** When a trade is open, the “take-profit” price is determined by looking at the highest high (for longs) or lowest low (for shorts) observed since entry, and then plotting a cross (“X”) at that level when the trend finally flips. This is purely for display. However, separate from that, this parameter can be adapted if you want a strictly ATR–based TP. In the “Minimal” version, TP is ≈ (highest high) once trend inverts, but you could rewrite it to use `entry_price + ATR×TP_Multiplier`.
22. **SL as ATR Multiple**
* **Input type:** Float (default 1.0, step 0.1)
* **Description:** While in a trade, a trailing SL line is plotted each bar. Its value is always `entry_price ± (ATR × SL_Multiplier)`. When the trend inverts, the SL no longer updates, and you see it on the chart.
### I. Display and Mode Options
23. **Show Debug Lines**
* **Input type:** Boolean (default true)
* **Description:** When enabled, the indicator will plot all intermediate lines—ATR SMA, ATR Threshold, +DI, –DI, ADX (current and HTF), HTF SMA, etc.—so that you can diagnose exactly what’s happening. Turn this off to hide all debug information and only see entry/exit shapes.
24. **Enable Scalping Mode**
* **Input type:** Boolean (default false)
* **Description:** If true, many of the “base” parameters are halved (e.g., RSI length becomes 7 instead of 14, ATR length becomes 7 instead of 14, ADX length becomes 7, etc.), and the ADX threshold is multiplied by 0.8. This makes all oscillators and moving averages more reactive, suited for very short-term (scalping) setups.
---
## 2. Core Calculation Blocks
Below is a high-level description of each logical block (in code order), translated from Pine into conceptual steps.
### A. Adjust Inputs if “Scalping Mode” Is On
If **Scalping Mode** = true, then:
* `RSI_Length` becomes `max(1, round(Base_RSI_Length / 2))`
* `EMA_Length` becomes `max(1, round(Base_EMA_Length / 2))`
* `ATR_Length` becomes `max(1, round(Base_ATR_Length / 2))`
* `Price_Change_Period` becomes `max(1, round(Base_Price_Change_Period / 2))`
* `SMA_Long_Length`, `SMA_Short1_Length`, and `SMA_Short2_Length` are each halved (minimum 1).
* `ADX_Length` = `max(1, round(Base_ADX_Length / 2))`
* `ADX_Threshold` = `Base_ADX_Threshold × 0.8`
* `Cooldown_Bars` = `max(0, round(Base_Cooldown_Bars / 2))`
Otherwise, all adjusted lengths = their base values.
### B. RSI, EMA & “AI Score” on Current Timeframe
1. **Compute RSI:**
* Uses the (possibly adjusted) `RSI_Length`.
* Denote this as `RSI_Value`.
2. **Compute ATR & Its SMA:**
* `ATR_Value` = `ta.atr(ATR_Length)`.
* `ATR_SMA` = `ta.sma(ATR_Value, ATR_SMA_Length)`.
* Then define `Volatility_Increase` = (`ATR_Value > ATR_SMA`).
* If the volatility has increased, the weighting of RSI vs. EMA changes.
3. **Compute Weights:**
* If `Volatility_Increase == true`, then:
* `RSI_Weight = 0.7`
* `EMA_Weight = 0.3`
* Otherwise:
* `RSI_Weight = 0.3`
* `EMA_Weight = 0.7`
4. **RSI Signal Component (`RSI_Sig`):**
* If `RSI_Value > RSI_Overbought`, then `RSI_Sig = –1`.
* Else if `RSI_Value < RSI_Oversold`, then `RSI_Sig = +1`.
* Otherwise, `RSI_Sig = 0`.
5. **EMA Value & Signal Component (`EMA_Sig`):**
* `EMA_Value` = `ta.ema(close, EMA_Length)`.
* `EMA_Sig = +1` if the current close crosses **above** the EMA; `EMA_Sig = –1` if the current close crosses **below** the EMA; else `0`.
6. **Compute Raw “AI Score”:**
$$
Raw\_AI = (RSI\_Sig \times RSI\_Weight)\;+\;(EMA\_Sig \times EMA\_Weight)
$$
Then,
$$
AI\_Score = \frac{Raw\_AI}{(RSI\_Weight + EMA\_Weight)}
$$
(This normalization ensures the score always ranges between –1 and +1 if both weights sum to 1.)
### C. Dynamic ATR Multiplier & Volatility Filter
1. **Volatility Factor:**
$$
Volatility\_Factor = \frac{ATR\_Value}{ATR\_SMA}
$$
2. **Dynamic ATR Multiplier:**
$$
ATR\_Multiplier = ATR\_Multiplier\_Base \times \sqrt{Volatility\_Factor}
$$
3. **High Volatility Condition (`High_Volatility`):**
* If `Disable_Volatility_Filter == true`, then treat `High_Volatility = true` always.
* Else, `High_Volatility = (ATR_Value > ATR_SMA × ATR_Multiplier)`.
### D. Price Change Percentage
* **Compute Price Change:**
$$
Price\_Change = \frac{(Close - Close[Price\_Change\_Period])}{Close[Price\_Change\_Period]} \times 100
$$
* This is the percent return from `Price_Change_Period` bars ago to now.
* For a valid long‐trend signal, we require `Price_Change > 0`; for a short trend, `Price_Change < 0`.
### E. Local SMAs for Trend/Reversal Filters
* `SMA_Close_Long` = `ta.sma(close, SMA_Long_Length)`.
* `SMA_Close_Short1` = `ta.sma(close, SMA_Short1_Length)`.
* `SMA_Close_Short2` = `ta.sma(close, SMA_Short2_Length)`.
These three SMAs help define the “local trend” and reversal breakout points:
* **Primary Trend Filter:**
* Price must be above `SMA_Close_Long` for an uptrend filter, or below `SMA_Close_Long` for a downtrend filter.
* **Reversal Filter:**
* A bullish reversal is detected if **(RSI < Oversold AND close crosses above EMA)** OR **(RSI < Oversold AND close crosses above SMA\_Close\_Short1)**.
* A bearish reversal is detected if **(RSI > Overbought AND close crosses below EMA)** OR **(RSI > Overbought AND close crosses below SMA\_Close\_Short1)**.
### F. Manual +DI, –DI & ADX on Current Timeframe
Instead of relying on the built-in `ta.adx`, the script calculates DI and ADX manually. This makes it easier to replicate the exact logic on a higher timeframe via `request.security`. The steps are:
1. **Directional Movement (DM) Components:**
* `Up_Move` = `high – high[1]`
* `Down_Move` = `low[1] – low`
* `Plus_DM` = `Up_Move` if (`Up_Move > Down_Move` AND `Up_Move > 0`), else `0`
* `Minus_DM` = `Down_Move` if (`Down_Move > Up_Move` AND `Down_Move > 0`), else `0`
2. **True Range (TR) Components:**
* `TR1` = `high – low`
* `TR2` = `abs(high – close[1])`
* `TR3` = `abs(low – close[1])`
* `True_Range` = `max(TR1, TR2, TR3)`
3. **Smoothed Averages (RMA):**
* `Sm_TR` = `ta.rma(True_Range, ADX_Length)`
* `Sm_Plus` = `ta.rma(Plus_DM, ADX_Length)`
* `Sm_Minus`= `ta.rma(Minus_DM, ADX_Length)`
4. **Compute DI%:**
$$
Plus\_DI = \frac{Sm\_Plus}{Sm\_TR} \times 100,\quad
Minus\_DI = \frac{Sm\_Minus}{Sm\_TR} \times 100
$$
5. **DX and ADX:**
$$
DX = \frac{|Plus\_DI - Minus\_DI|}{Plus\_DI + Minus\_DI} \times 100,\quad
ADX = ta.rma(DX, ADX_Length)
$$
These values are referred to as `(plus_di, minus_di, adx_val)` for the current timeframe.
---
## 3. Higher Timeframe (HTF) Confirmation Function
If **Use Higher Timeframe Confirmation** is enabled, the script calls a single helper (Pine) function `f_htf` with two parameters: the ADX length and the SMA length (both taken from the “base” or “scaled” values). Internally, `f_htf` simply reruns the manual DI/ADX logic (same as above) on the higher timeframe’s bar data, and also includes that timeframe’s closing price and its SMA for trend comparison.
* **Request.Security Call:**
```
[ht_close, ht_sma, ht_pdi, ht_mdi, ht_adx] = request.security(
syminfo.tickerid,
higher_tf,
f_htf(adx_length, sma_long_len),
lookahead=barmerge.lookahead_off
)
```
* `lookahead=barmerge.lookahead_off` ensures that no HTF value “paints” early; you always see only confirmed HTF bars.
* The returned tuple provides:
1. `ht_close` = HTF closing price
2. `ht_sma` = HTF SMA of length `sma_long_len`
3. `ht_pdi` = HTF +DI percentage
4. `ht_mdi` = HTF –DI percentage
5. `ht_adx` = HTF ADX value
---
## 4. Trend & Reversal Filters (Current & HTF)
### A. Current-Timeframe Trend Filter
1. **Uptrend\_Basic (Current TF)**
$$
(plus\_di > minus\_di)\;\land\;(adx\_val > ADX\_Threshold)\;\land\;(close > SMA\_Close\_Long)
$$
2. **Downtrend\_Basic (Current TF)**
$$
(minus\_di > plus\_di)\;\land\;(adx\_val > ADX\_Threshold)\;\land\;(close < SMA\_Close\_Long)
$$
3. **Trend Confirmation by Bars:**
* `Bars_Since_Below` = number of bars since `close <= SMA_Close_Long`.
* `Bars_Since_Above` = number of bars since `close >= SMA_Close_Long`.
* If `Uptrend_Basic == true` AND `Bars_Since_Below ≥ Trend_Confirmation_Bars` → mark `Uptrend_Confirm = true`.
* If `Downtrend_Basic == true` AND `Bars_Since_Above ≥ Trend_Confirmation_Bars` → mark `Downtrend_Confirm = true`.
### B. Reversal Filters (Current TF)
1. **Bullish Reversal (`Rev_Bullish`):**
* If `(RSI < RSI_Oversold AND close crosses above EMA_Value)` OR
`(RSI < RSI_Oversold AND close crosses above SMA_Close_Short1)`
→ then `Rev_Bullish = true`.
2. **Bearish Reversal (`Rev_Bearish`):**
* If `(RSI > RSI_Overbought AND close crosses below EMA_Value)` OR
`(RSI > RSI_Overbought AND close crosses below SMA_Close_Short1)`
→ then `Rev_Bearish = true`.
### C. Higher-Timeframe Trend Filter (HTF)
1. **HTF Uptrend (`HT_Uptrend`):**
$$
(ht\_pdi > ht\_mdi)\;\land\;(ht\_adx > ADX\_Threshold)\;\land\;(ht\_close > ht\_sma)
$$
2. **HTF Downtrend (`HT_Downtrend`):**
$$
(ht\_mdi > ht\_pdi)\;\land\;(ht\_adx > ADX\_Threshold)\;\land\;(ht\_close < ht\_sma)
$$
3. **Combine Current & HTF:**
* If **Use\_HTF\_Confirmation == true**, then:
* `Uptrend_Confirm := Uptrend_Confirm AND HT_Uptrend`
* `Downtrend_Confirm := Downtrend_Confirm AND HT_Downtrend`
* Otherwise, just use the current timeframe’s `Uptrend_Confirm` and `Downtrend_Confirm`.
4. **Define `CurrentTrend` (Integer):**
* `CurrentTrend = +1` if `Uptrend_Confirm == true`.
* `CurrentTrend = –1` if `Downtrend_Confirm == true`.
* Otherwise, `CurrentTrend = 0`.
5. **Reset “One Trade Per Trend”:**
* There is a persistent variable `LastTradeTrend`.
* Every time `CurrentTrend` flips (i.e., `CurrentTrend != CurrentTrend[1]`), the code sets `LastTradeTrend := 0`.
* That allows one new entry once the detected trend has changed.
---
## 5. One‐Time “Cooldown” Logic
* **`LastSignalBar`**
* A persistent integer (initially undefined).
* After each confirmed long or short entry, `LastSignalBar` is set to the bar index where that signal fired.
* **`Bars_Since_Signal`**
* If `LastSignalBar` is undefined, treat as a very large number (so that initial signals are always allowed).
* Otherwise, `Bars_Since_Signal = bar_index – LastSignalBar`.
* **Cooldown Check:**
* A new long (or short) can only be generated if `(Bars_Since_Signal > Signal_Cooldown)`.
* This prevents multiple signals in rapid succession.
---
## 6. Entry Conditions (No Repaint)
All of the conditions below are calculated “intrabar,” but the script only actually registers a **signal** on **bar close** (`barstate.isconfirmed`) so that signals never repaint.
### A. Trend‐Based “Raw” Conditions
1. **Trend\_Long\_Raw:**
$$
(AI\_Score > AI\_Score\_Threshold)\;\land\;Uptrend\_Confirm\;\land\;High\_Volatility\;\land\;(Price\_Change > 0)
$$
2. **Trend\_Short\_Raw:**
$$
(AI\_Score < -AI\_Score\_Threshold)\;\land\;Downtrend\_Confirm\;\land\;High\_Volatility\;\land\;(Price\_Change < 0)
$$
### B. Reversal “Raw” Conditions
1. **Rev\_Long\_Raw:**
$$
Rev\_Bullish\;\land\;(CurrentTrend \neq +1)
$$
2. **Rev\_Short\_Raw:**
$$
Rev\_Bearish\;\land\;(CurrentTrend \neq -1)
$$
### C. Combine Raw Signals
* `Raw_Long = Trend_Long_Raw OR Rev_Long_Raw`.
* `Raw_Short = Trend_Short_Raw OR Rev_Short_Raw`.
### D. Confirmed Long/Short Signal Flags
On each new bar **close** (`barstate.isconfirmed == true`):
* **Long\_Signal\_Confirmed** can fire if:
1. `Raw_Long == true`
2. `LastTradeTrend != +1` (we haven’t already taken a long in this same trend)
3. `Bars_Since_Signal > Signal_Cooldown`
If all three hold, then on this bar close the code sets:
* `Long_Signal = true`
* `LastTradeTrend := +1`
* `LastSignalBar := bar_index`
Otherwise, `Long_Signal := false` on this bar.
* **Short\_Signal\_Confirmed** works the same way but with `Raw_Short`, `LastTradeTrend != -1`, etc.
If triggered, it sets `Short_Signal = true`, `LastTradeTrend := -1`, and `LastSignalBar := bar_index`. Otherwise `Short_Signal := false`.
* **Important:** If the bar is still forming (`else` branch of `barstate.isconfirmed`), then both `Long_Signal` and `Short_Signal` are forced to `false`. This guarantees that no shape or alert appears until the bar actually closes.
---
## 7. Plotting Entry/Exit Shapes
1. **Trend Long Signal (Triangle Up)**
* Condition: `Long_Signal == true` **AND** `Trend_Long_Raw == true`.
* Appearance: A small, semi-transparent lime green triangle drawn **below** the bar.
2. **Trend Short Signal (Triangle Down)**
* Condition: `Short_Signal == true` **AND** `Trend_Short_Raw == true`.
* Appearance: A small, semi-transparent maroon triangle drawn **above** the bar.
3. **Reversal Long Signal (Circle)**
* Condition: `Long_Signal == true` **AND** `Rev_Long_Raw == true`.
* Appearance: A tiny, more transparent green circle drawn **below** the bar.
4. **Reversal Short Signal (Circle)**
* Condition: `Short_Signal == true` **AND** `Rev_Short_Raw == true`.
* Appearance: A tiny, more transparent red circle drawn **above** the bar.
Since `Long_Signal` and `Short_Signal` only ever become true at bar close, these shapes are never repainted or removed once drawn.
---
## 8. Unified Alert Message
* As soon as a new bar closes with either `Long_Signal` or `Short_Signal == true`, an alert message is sent:
* If `Long_Signal`, then `alert_msg = "action=BUY"`.
* If `Short_Signal`, then `alert_msg = "action=SELL"`.
* If neither, `alert_msg = ""` (no alert).
* The code calls `alert(alert_msg, freq=alert.freq_once_per_bar)` only if `barstate.isconfirmed` and `alert_msg` is non‐empty. This ensures exactly one alert per confirmed bar, no intrabar pops.
---
## 9. Dynamic TP/SL Logic (Minimal Implementation)
Once a long or short position is “open,” the script tracks these variables:
1. **Persistent Flags and Prices** (all persist between bars until reset):
* `InLong` (Boolean)
* `InShort` (Boolean)
* `Long_Max` (Float)
* `Short_Min` (Float)
* `Entry_Price` (Float)
2. **On Bar Close:**
* If `Long_Signal == true` →
* Set `InLong := true`,
* `Entry_Price := close` of that bar,
* `Long_Max := high[1]` (last bar’s high, so that we’re not using “future” data).
* If `Short_Signal == true` →
* Set `InShort := true`,
* `Entry_Price := close`,
* `Short_Min := low[1]`.
3. **While `InLong == true`:**
* Continuously update `Long_Max = max(Long_Max, current high)` on each bar (intrabar, but finalized each close).
* Compute a dynamic SL:
$$
SL_{Long} = Entry\_Price - (ATR \times SL\_ATR\_Multiplier).
$$
* If **current trend** flips to non-uptrend (`CurrentTrend != +1`), mark `ExitLong = true`.
* Then the routine plots `TP_Long = Long_Max` as a cross (“X”) at that level.
* Set `InLong := false` so that no further changes to `Long_Max` or `Entry_Price` happen on future bars.
4. **While `InShort == true`:**
* Continuously update `Short_Min = min(Short_Min, current low)`.
* Compute a dynamic SL:
$$
SL_{Short} = Entry\_Price + (ATR \times SL\_ATR\_Multiplier).
$$
* If trend flips to non-downtrend (`CurrentTrend != –1`), mark `ExitShort = true`.
* Then the routine plots `TP_Short = Short_Min`.
* Set `InShort := false` to freeze those values.
5. **Plotting TP/SL if “Show Debug” is On:**
* **TP Shapes:**
* When `ExitLong == true`, plot a solid lime “X” at `TP_Long` (highest high).
* When `ExitShort == true`, plot a solid maroon “X” at `TP_Short` (lowest low).
* **SL Lines:**
* If still `InLong`, draw a thin red line at `SL_Long` on each bar.
* If still `InShort`, draw a thin green line at `SL_Short`.
Thus, your charts visually show the highest‐high take-profit cross for longs, the lowest-low take-profit cross for shorts, and a continuously updating trailing SL until the trend flips. Because all of this is triggered on confirmed bars, nothing “jumps around” after the fact.
---
## 10. Debug‐Only Plot Lines (When Enabled)
When **Show Debug Lines** = true, the indicator will also plot:
1. **ATR SMA (Orange):**
* The simple moving average of ATR over `ATR_SMA_Length`.
2. **ATR Threshold (Yellow):**
* `ATR_SMA × ATR_Multiplier` (the dynamically scaled threshold).
3. **+DI & –DI (Current TF):**
* +DI plotted as a green line, –DI plotted as a red line (opacity \~70%).
4. **ADX (Current TF, Blue):**
* A blue line for the present timeframe’s ADX.
5. **ADX Threshold (Gray):**
* A horizontal gray line showing `ADX_Threshold`.
6. **+DI & –DI (HTF, Darker Colors):**
* If HTF confirmation is on, “HTF +DI” is a greener but more transparent line; “HTF –DI” is a redder but more transparent line.
7. **ADX (HTF, Blue but Transparent):**
* HTF ADX plotted in blue (high transparency).
8. **HTF SMA (Orange, Transparent):**
* The higher timeframe’s SMA (same length as `SMA_Long_Length`), drawn in fainter orange.
9. **Volatility Zone Fill (Yellow Tinted Area):**
* Fills the area between `ATR_SMA` and `ATR_SMA × ATR_Multiplier`.
* Indicates “normal” versus “high‐volatility” regimes.
These debug lines are purely visual aids. Disable them if you want a cleaner chart.
---
## 11. Putting It All Together — Step-By-Step Flow
1. **Read Inputs** (RSI lengths, EMA length, ATR settings, etc.).
2. **Optionally Halve All Lengths** if “Scalping Mode” is checked.
3. **Calculate Current TF Indicators:**
* RSI, ATR, ATR\_SMA, EMA, price change, various SMAs, DI/ADX.
4. **Compute “AI Score”** (weighted sum of RSI and EMA signals).
5. **Compute Dynamic ATR Multiplier** and decide if “High Volatility” is true.
6. **Compute Raw Trend/Reversal Conditions** on the current timeframe (without triggering yet).
7. **Fetch HTF Values** in one `request.security` call (SMAs, DI/ADX).
8. **Combine Current & HTF Trend Filters** to confirm `Uptrend_Confirm` or `Downtrend_Confirm`.
9. **Check Reversal Conditions** (price crossing EMA or SMA short, in overbought/oversold zones).
10. **Enforce “One Trade Per Trend”** (clear `LastTradeTrend` whenever `CurrentTrend` flips).
11. **Enforce Cooldown** (must wait at least `Signal_Cooldown` bars since the prior signal).
12. **On Bar Close:**
* If `Raw_Long` AND not already in a long trend AND cooldown met, then fire `Long_Signal`.
* Else if `Raw_Short` AND not already in a short trend AND cooldown met, then fire `Short_Signal`.
* Otherwise, no new signal on this bar.
13. **Plot Long/Short Entry Shapes** according to whether it was a Trend signal or a Reversal signal.
14. **Send Alert** (“action=BUY” or “action=SELL”) exactly once per confirmed bar.
15. **If New Long/Short Signal, Set `InLong`/`InShort`, Record Entry Price, Initialize `Long_Max`/`Short_Min`.**
16. **While `InLong` is true:** Update `Long_Max = max(previous Long_Max, current high)`. Compute `SL_Long`. If the current trend flips (no longer uptrend), set `ExitLong = true`, plot a “TP X,” and close the position logic.
17. **While `InShort` is true:** Similarly update `Short_Min`, compute `SL_Short`, and if trend flips, set `ExitShort = true`, plot a “TP X,” and close the position logic.
18. **Optionally Display Debug Lines** (ATR SMA, ATR threshold, DI/ADX, HTF DI/ADX, etc.).
---
## 12. How to Use in TradingView Community
When you publish this indicator to the TradingView community—choosing “Protected” or “Invite-only” visibility—you can paste the above description into the “Description” field. Users will see exactly what each input does, how signals are generated, and what the various plotted lines represent, **without ever seeing the script source**. In this way, the code itself remains hidden but the logic is fully documented.
1. **Go to “Create New Indicator”** on TradingView.
2. **Paste Your Pine Code** (the full indicator script) in the Pine editor and save it.
3. **Set Visibility = Protected** (or Invite-only).
4. **In the “Description” Text Box, paste the entirety of this document** (steps 1–11).
5. **Click “Publish Script.”**
Users who view your indicator will see its name (“AI Strat Adaptive v3 (NoRepaint)”), a list of all inputs (with default values), and the detailed English description above. They can then load it on any chart, adjust inputs, and see the plotted signals, TP/SL lines, and optional debug overlays—without accessing the underlying Pine code.
---
### Summary of Key Points
* **RSI, EMA, ATR, DI/ADX, and “AI Score”** work together to define “trend vs. reversal.”
* **Dynamic volatility filter** uses ATR and ATR\_SMA to adapt the weighting of RSI vs. EMA and decide whether “volatility is high enough” to permit a trend trade.
* **One trade per detected trend** and a **cooldown period** prevent over‐trading.
* **Higher timeframe confirmation** (optional) further filters out noise.
* **No-repaint logic**:
* All signals only appear at bar close (`barstate.isconfirmed`).
* HTF values are fetched with `lookahead=barmerge.lookahead_off`.
* **Entry shapes** (triangles and circles) clearly mark trend vs. reversal entries.
* **Dynamic TP/SL**: highest‐high (or lowest‐low) since entry is used as TP, ATR×multiplier as SL.
* **Debug mode** (optional) shows every intermediate line for full transparency.
Use this description verbatim (or adapt it slightly for your personal style) when publishing. That way, your community sees exactly how each component works—inputs, functions, filters—while the Pine source code remains private.
Nota Keluaran
Changed the name of the indicator in EnglishSkrip dilindungi
Skrip ini diterbitkan sebagai sumber tertutup. Akan tetapi, anda boleh menggunakannya secara bebas dan tanpa apa-apa had – ketahui lebih di sini.
Penafian
Maklumat dan penerbitan adalah tidak bertujuan, dan tidak membentuk, nasihat atau cadangan kewangan, pelaburan, dagangan atau jenis lain yang diberikan atau disahkan oleh TradingView. Baca lebih dalam Terma Penggunaan.
Skrip dilindungi
Skrip ini diterbitkan sebagai sumber tertutup. Akan tetapi, anda boleh menggunakannya secara bebas dan tanpa apa-apa had – ketahui lebih di sini.
Penafian
Maklumat dan penerbitan adalah tidak bertujuan, dan tidak membentuk, nasihat atau cadangan kewangan, pelaburan, dagangan atau jenis lain yang diberikan atau disahkan oleh TradingView. Baca lebih dalam Terma Penggunaan.