PROTECTED SOURCE SCRIPT
Max Price Range Deviation
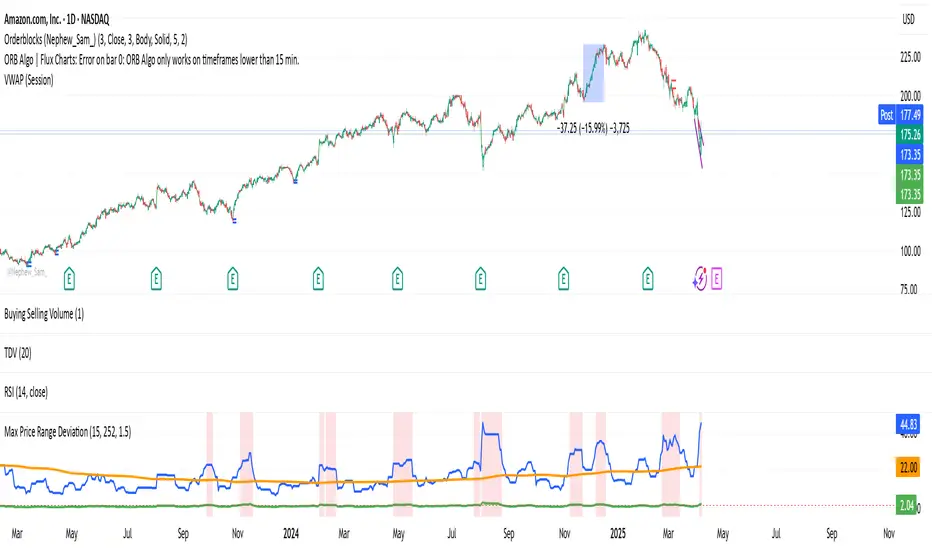
This indicator measures how far a stock has moved in recent days relative to its typical movement over a longer period.
🧠 What it does:
Calculates the absolute price range (highest high − lowest low) over a recent number of days.
Compares this recent range to the average max range from rolling windows of the same size over a longer lookback period.
Plots:
✅ Recent Range (blue line)
✅ Average Historical Range (orange line)
✅ Ratio of Recent to Average (green line)
Highlights when recent movement is significantly higher than normal using a configurable threshold.
⚙️ Inputs:
Recent Period (days): Number of days to calculate the current price move.
Lookback Period (days): Number of days used to calculate the average historical range.
High Move Threshold (x avg): If the recent move exceeds this multiple of average, it's flagged.
🛠️ Use Cases:
Spot unusually large price swings.
Identify good opportunities to sell out-of-the-money options (e.g., covered calls or credit spreads) when moves are extended.
Avoid chasing late-stage breakouts.
Skrip dilindungi
Skrip ini diterbitkan sebagai sumber tertutup. Akan tetapi, anda boleh menggunakannya secara bebas dan tanpa apa-apa had – ketahui lebih di sini.
Penafian
Maklumat dan penerbitan adalah tidak bertujuan, dan tidak membentuk, nasihat atau cadangan kewangan, pelaburan, dagangan atau jenis lain yang diberikan atau disahkan oleh TradingView. Baca lebih dalam Terma Penggunaan.