OPEN-SOURCE SCRIPT
Absolute Momentum Intensity
No lag, no boundaries, real momentum indicator.
Momentum = mass × velocity
In trading, this would be: volume × candle size. But due to the huge differences in volumes and volatility in the market, strong momentum crushes (flattens) average momentum, making it unpractical in an indicator. AMI provides a usable and adjustable workaround to this problem.
HOW DOES AMI WORK?
AMI measures and plots the momentum of each candle individually, with a formula I invented (or so I believe).
Formula: (Actual volume / Moving average of the volumes) × (Actual size of the candle / Moving average of the size of the candles)
Put simply, it multiplies the ratio between actual and past volumes, by the ratio between actual and past candles' sizes.
The length of the moving averages used in AMI's calculation is called "Contrast" in the settings.
Feel free to adjust the contrast of AMI to fit your needs.
The result is plotted starting from the last point. So the angle of each segment expresses the momentum of the corresponding candle.
Note: AMI will not run without enough candles or volume datas, on higher timeframes for example (W,M...).
HOW TO READ AMI?
https://www.tradingview.com/x/e4xCF6ba/
DIVERGENCES
Divergences are relevant as long as there's amplitude in the chart. But it is still hard to estimate how far the expected move will go.
AMI comes with a divergence detection system. It won't show all the divergences though. Just the ones it can pick. So you might look for more, and adjust the settings to your needs.
This part of the script is independant from AMI, and easy to identify, so you can delete it if you don't need it.
DO NOT BASE YOUR TRADING DECISIONS ON 1 SINGLE INDICATOR'S SIGNALS.
Always confirm your ideas by other means, like price action and indicators of a different nature.
Momentum = mass × velocity
In trading, this would be: volume × candle size. But due to the huge differences in volumes and volatility in the market, strong momentum crushes (flattens) average momentum, making it unpractical in an indicator. AMI provides a usable and adjustable workaround to this problem.
HOW DOES AMI WORK?
AMI measures and plots the momentum of each candle individually, with a formula I invented (or so I believe).
Formula: (Actual volume / Moving average of the volumes) × (Actual size of the candle / Moving average of the size of the candles)
Put simply, it multiplies the ratio between actual and past volumes, by the ratio between actual and past candles' sizes.
The length of the moving averages used in AMI's calculation is called "Contrast" in the settings.
- A contrast of 20 shows every single impulse.
- 100 flattens small moves, thus revealing when the momentum is at its strongest.
Feel free to adjust the contrast of AMI to fit your needs.
The result is plotted starting from the last point. So the angle of each segment expresses the momentum of the corresponding candle.
Note: AMI will not run without enough candles or volume datas, on higher timeframes for example (W,M...).
HOW TO READ AMI?
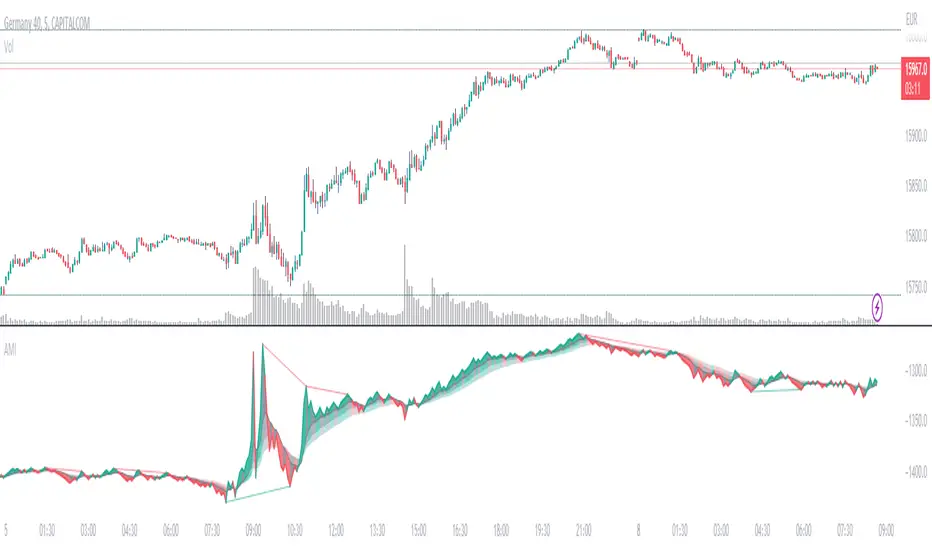
- AMI's line color, angle, and backgrounds help identify the current momentum as bullish, bearish, weak, or strong.
- When AMI crosses the closest ribbon's line (which is in gray by default), its color changes, signaling a shift in momentum.
- When the 3 ribbons are fully deployed, separated by large backgrounds, the momentum can be considered strong. This is what we are looking for.
- When the momentum decreases, the background color changes (gray by default). It can be nothing, or it can be an early sign of consolitation or even reversal, especially if more do follow.
- AMI adjusts to the size of its pane. Therefore, it is a good idea to keep a period of strong momentum in the screen, as a scale.
- Comparing the actual momentum with the past ones sheds some light on the intensity of the price action.
https://www.tradingview.com/x/e4xCF6ba/
DIVERGENCES
Divergences are relevant as long as there's amplitude in the chart. But it is still hard to estimate how far the expected move will go.
AMI comes with a divergence detection system. It won't show all the divergences though. Just the ones it can pick. So you might look for more, and adjust the settings to your needs.
This part of the script is independant from AMI, and easy to identify, so you can delete it if you don't need it.
DO NOT BASE YOUR TRADING DECISIONS ON 1 SINGLE INDICATOR'S SIGNALS.
Always confirm your ideas by other means, like price action and indicators of a different nature.
Skrip sumber terbuka
Dalam semangat TradingView sebenar, pencipta skrip ini telah menjadikannya sumber terbuka, jadi pedagang boleh menilai dan mengesahkan kefungsiannya. Terima kasih kepada penulis! Walaupuan anda boleh menggunakan secara percuma, ingat bahawa penerbitan semula kod ini tertakluk kepada Peraturan Dalaman.
Penafian
Maklumat dan penerbitan adalah tidak bertujuan, dan tidak membentuk, nasihat atau cadangan kewangan, pelaburan, dagangan atau jenis lain yang diberikan atau disahkan oleh TradingView. Baca lebih dalam Terma Penggunaan.