PROTECTED SOURCE SCRIPT
Awesome Oscillator (AO) - Two EMA / SMA
Awesome Oscillator with EMA indicator plots Awesome Oscillator indicator (Bill M. Williams) on Two Exponential Moving Averages.
The value of the Awesome Oscillator indicator is calculated as the difference between moving averages over these two time frames.
Rather than using closing prices, though, these moving averages use the midpoints of the bars (i.e. halfway between the high and the low).
Midpoint = (H + L)/2
AO = Fast Moving Average - Slow Moving Average
The indicator subtracts the Fast Moving Average from the Slow Moving Average and plots this value as a histogram.
It measures the market momentum with the aim to detect potential trend direction or trend reversals and momentum.
How to read the Indicator ?
The value of the Awesome Oscillator indicator is calculated as the difference between moving averages over these two time frames.
Rather than using closing prices, though, these moving averages use the midpoints of the bars (i.e. halfway between the high and the low).
Midpoint = (H + L)/2
AO = Fast Moving Average - Slow Moving Average
The indicator subtracts the Fast Moving Average from the Slow Moving Average and plots this value as a histogram.
It measures the market momentum with the aim to detect potential trend direction or trend reversals and momentum.
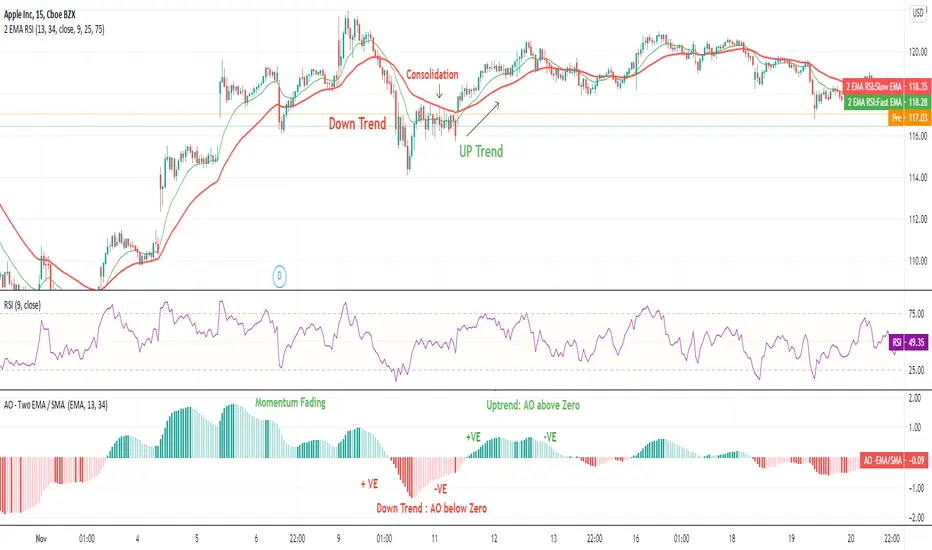
How to read the Indicator ?
- When AO is greater than zero line, it is an uptrend. When AO is less than zero it is a downtrend.Rising AO indicates momentum intact. Falling AO indicates momentum loosing the steam.When AO is nearing zero, one can expect the trend reversal & big move in opposite direction in trending market.
Skrip dilindungi
Skrip ini diterbitkan sebagai sumber tertutup. Akan tetapi, anda boleh menggunakannya secara bebas dan tanpa apa-apa had – ketahui lebih di sini.
Penafian
Maklumat dan penerbitan adalah tidak bertujuan, dan tidak membentuk, nasihat atau cadangan kewangan, pelaburan, dagangan atau jenis lain yang diberikan atau disahkan oleh TradingView. Baca lebih dalam Terma Penggunaan.