PRICE MOVEMENT STATISTICS
## Foundation
Price Movement Statistics (PMS) represents a fundamentally different approach to market analysis compared to traditional indicators like RSI, Moving Averages, or Bollinger Bands. While most indicators rely on mathematical transformations of price data, PMS implements a **machine learning-inspired nearest-neighbor algorithm** that compares current market conditions against thousands of historical patterns across multiple correlated instruments.
### What Makes This Original
Unlike standard indicators that follow predetermined formulas, PMS:
1. **Multi-Symbol Pattern Database**: Analyzes up to 4 different but correlated symbols simultaneously, creating a massive historical pattern database that single-symbol indicators cannot access
2. **8-Feature Normalized Vector Comparison**: Converts each candlestick into 8 numerical features (body-to-range ratios, wick proportions, relative positioning, momentum characteristics) and uses Manhattan distance calculations to find statistically similar historical situations
3. **Forward-Looking Statistical Validation**: Instead of just identifying patterns, PMS tracks what actually happened 1-5 bars after similar patterns occurred historically, providing probabilistic forecasts with sample sizes and confidence levels
4. **Adaptive Similarity Scoring**: Uses real-time distance calculations between current conditions and historical patterns, allowing traders to see exactly how many similar cases existed and their outcomes
## Technical Methodology Explained
### Pattern Recognition Engine
The core algorithm transforms each market condition into a normalized 8-dimensional vector containing:
- Short vs. long-term range ratios computed using proprietary envelope calculations
- Price position relative to recent ranges using adaptive scaling methods
- Volatility comparisons across multiple timeframes with logarithmic return analysis
- Momentum divergences between short and long-term linear regression slopes
- Volume behavior patterns using statistical deviation scoring
- Candlestick structure metrics including ATR ratios and boundary touch frequencies
### Advanced Code Architecture
**Multi-Symbol Data Pipeline**: The system employs Pine Script's `request.security()` function in a sophisticated loop structure that simultaneously processes up to 4 different instruments. Each symbol contributes its own 8-feature vector, creating a 32-dimensional search space that dramatically expands pattern recognition capabilities beyond single-symbol analysis.
**Adaptive Normalization Engine**: Rather than using simple percentage changes, the code implements a custom `scale_adaptive()` function that ranks current values against rolling historical distributions. This percentile-based approach ensures pattern recognition remains consistent across different market volatility regimes and price levels.
**Distance Matrix Calculations**: The matching algorithm runs nested loops through thousands of historical bars, computing Manhattan distances for each potential match. The code optimizes performance by using vectorized operations and early termination conditions when similarity thresholds aren't met.
**Forward-Looking Analysis Pipeline**: Once matches are identified, the system implements a sophisticated outcome tracking mechanism that categorizes future price movements, volume behaviors, and candle characteristics. This requires careful index management to avoid look-ahead bias while maintaining real-time calculation efficiency.
### Similarity Matching Process
1. **Data Normalization**: Features are processed through custom percentile ranking against 500-bar rolling windows
2. **Distance Calculation**: Optimized Manhattan distance computation across 8-dimensional vectors with early exit conditions
3. **Multi-Symbol Aggregation**: Matches from different symbols are weighted and combined using statistical averaging techniques
4. **Threshold Filtering**: Dynamic similarity boundaries that adapt to market volatility conditions
5. **Outcome Analysis**: Forward-looking statistical compilation with bias tracking and magnitude calculations
### Statistical Output Generation
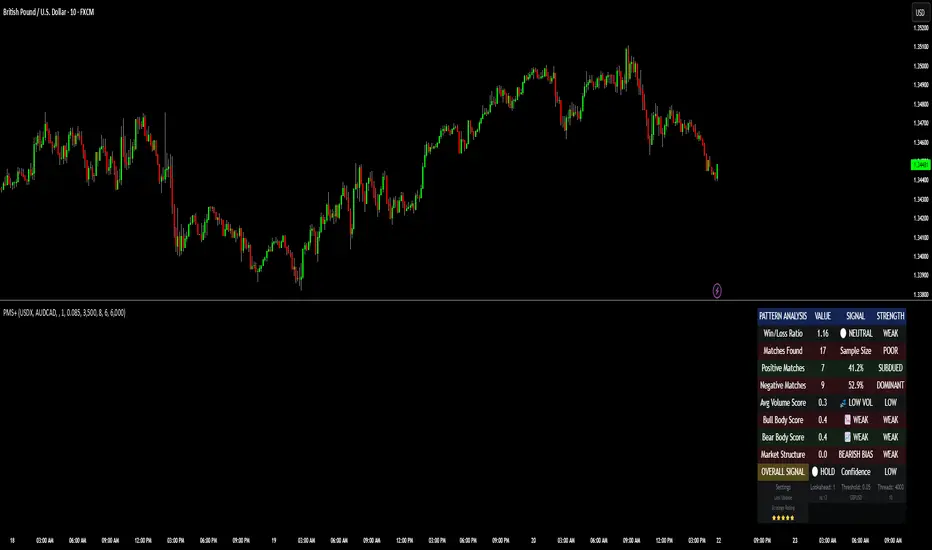
The system's proprietary aggregation engine provides:
- **Win/Loss Ratios**: Calculated from actual forward-price movements with statistical weighting
- **Sample Sizes**: Match counts across all symbols with confidence scoring algorithms
- **Average Magnitude**: Expected move calculations using historical outcome distributions
- **Volume Context**: Pattern-specific volume analysis using normalized scoring methods
- **Directional Bias**: Multi-timeframe probability calculations with cross-symbol validation
## Why This Approach is Worth the Investment
### Beyond Traditional Indicators
Standard indicators like RSI or MACD give you oversold/overbought signals or momentum divergences, but they don't answer the crucial question: "What happened historically when similar conditions occurred?" PMS bridges this gap by providing:
1. **Quantified Probabilities**: Instead of subjective pattern recognition, you get actual win rates and sample sizes
2. **Cross-Market Validation**: Patterns confirmed across multiple correlated instruments carry more statistical weight
3. **Sample Size Transparency**: You can see whether a signal is based on 5 occurrences or 500, adjusting confidence accordingly
4. **Magnitude Expectations**: Historical data shows not just direction, but expected move sizes
### Practical Trading Applications
**Entry Timing**: When PMS shows >70% historical win rate with 100+ matches, you have statistical evidence supporting your entry rather than relying on visual pattern interpretation.
**Risk Management**: Historical magnitude data helps size positions appropriately based on expected adverse moves in similar past situations.
**Confirmation**: Multi-symbol analysis provides cross-market confirmation that single-symbol indicators cannot offer.
## How to Use the System
### Signal Interpretation
- **Bias Ratio >1.5**: Historically bullish (more winning long trades than losing ones)
- **Bias Ratio <0.67**: Historically bearish (more winning short trades than losing ones)
- **Sample Size >50**: High confidence (sufficient historical data)
- **Sample Size <20**: Low confidence (limited historical precedent)
### Setup Optimization
- **Symbol Selection**: Choose 3-4 correlated instruments (e.g., stock + sector ETF + index, or currency pairs with base currency relationships)
- **Timeframe Coordination**: Use higher timeframes for broader context, lower timeframes for precise entry timing
- **Threshold Adjustment**: Lower similarity thresholds find more specific matches; higher thresholds increase sample sizes
## Technical Requirements and Limitations
**Data Depth**: Requires minimum 1000 bars per symbol for meaningful analysis; 3000+ bars recommended for optimal performance.
**Computational Load**: Real-time pattern matching across multiple symbols and thousands of historical bars requires TradingView's advanced Pine Script capabilities.
**Market Applicability**: Most effective in liquid markets with sufficient historical data; less reliable in newly listed instruments or during unprecedented market conditions.
## Important Disclaimers
This system identifies historical statistical patterns under similar conditions—it does not predict future movements with certainty. Effectiveness depends on intelligent symbol selection, appropriate timeframe usage, and integration with proper risk management. Past performance patterns do not guarantee future results, and all trading involves substantial risk of loss.
The algorithm's sophistication lies not in complex mathematical formulas, but in its ability to efficiently search through massive historical datasets and quantify pattern outcomes—something impossible to do manually and unavailable in standard technical indicators.
Skrip jemputan sahaja
Hanya pengguna disahkan oleh penulis boleh mengakses skrip ini. Anda perlu memohon dan mendapatkan kebenaran untuk menggunakannya. Keizinan selalunya diberikan selepas pembayaran. Untuk lebih butiran, ikuti arahan penulis di bawah atau hubungi Future_2x secara terus.
TradingView TIDAK menyarankan pembayaran atau penggunaan skrip kecuali anda mempercayai sepenuhnya penulis dan memahami bagaimana ia berfungsi. Anda juga boleh menjumpai alternatif sumber terbuka dan percuma yang lain di dalam skrip komuniti kami.
Arahan penulis
Penafian
Skrip jemputan sahaja
Hanya pengguna disahkan oleh penulis boleh mengakses skrip ini. Anda perlu memohon dan mendapatkan kebenaran untuk menggunakannya. Keizinan selalunya diberikan selepas pembayaran. Untuk lebih butiran, ikuti arahan penulis di bawah atau hubungi Future_2x secara terus.
TradingView TIDAK menyarankan pembayaran atau penggunaan skrip kecuali anda mempercayai sepenuhnya penulis dan memahami bagaimana ia berfungsi. Anda juga boleh menjumpai alternatif sumber terbuka dan percuma yang lain di dalam skrip komuniti kami.