OPEN-SOURCE SCRIPT
Price above/below EMA
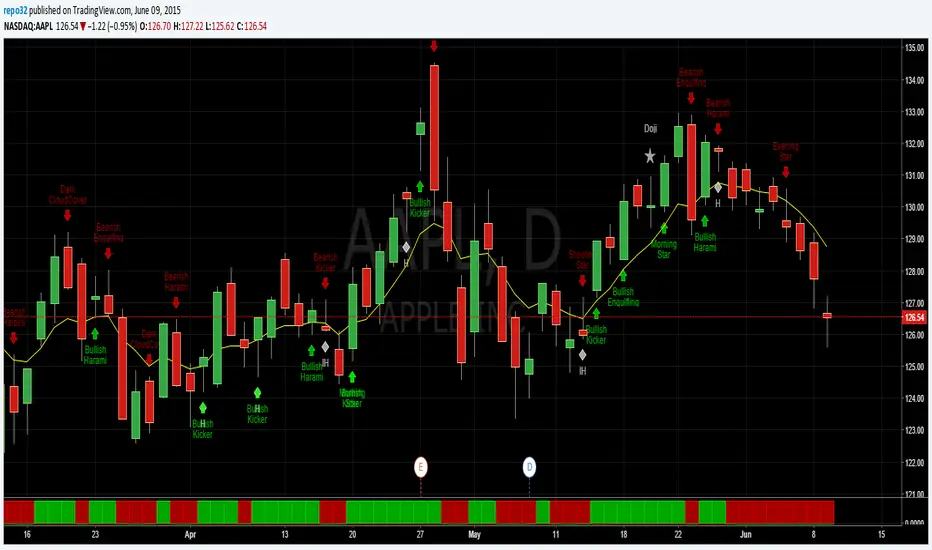
This script will give you red/green columns to indicate if price is above or below a certain EMA. With Candlestick charting, we are looking for price in relation to the 8 ema Trigger Line (T-Line). You can adjust this indicator to fit your need. Simple, but nice to quickly see.
Oops. Last line's title should be "Sell". Doesn't affect display though.
Oops. Last line's title should be "Sell". Doesn't affect display though.
Skrip sumber terbuka
Dalam semangat TradingView sebenar, pencipta skrip ini telah menjadikannya sumber terbuka, jadi pedagang boleh menilai dan mengesahkan kefungsiannya. Terima kasih kepada penulis! Walaupuan anda boleh menggunakan secara percuma, ingat bahawa penerbitan semula kod ini tertakluk kepada Peraturan Dalaman.
Penerbitan berkaitan
Penafian
Maklumat dan penerbitan adalah tidak bertujuan, dan tidak membentuk, nasihat atau cadangan kewangan, pelaburan, dagangan atau jenis lain yang diberikan atau disahkan oleh TradingView. Baca lebih dalam Terma Penggunaan.