OPEN-SOURCE SCRIPT
Telah dikemas kini Master Simple Indicator
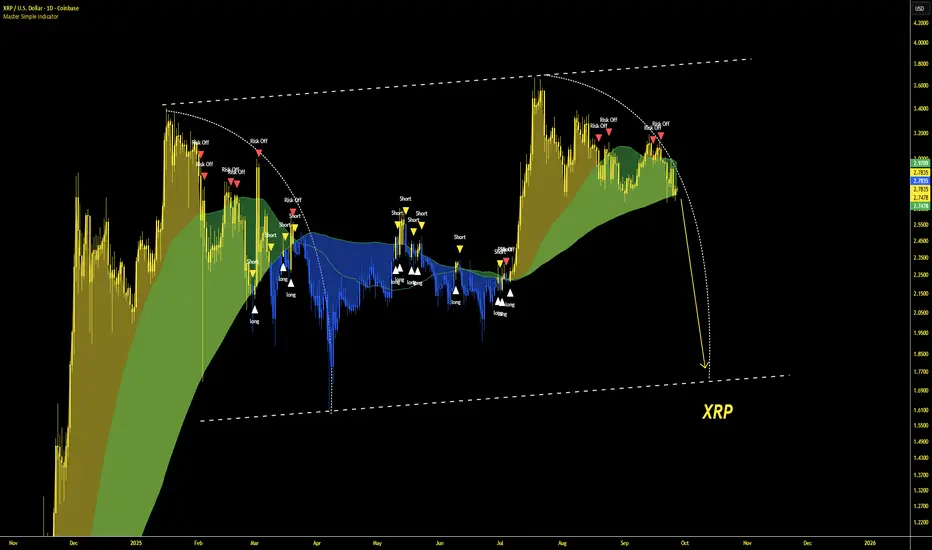
The streamlined Pine Script, created by masterbtcltc, is a technical analysis indicator that overlays on a price chart to provide buy and sell signals based on a dynamic 120-day simple moving average (SMA). Here's how it works:
Dynamic Moving Average: Calculates a 120-day SMA (ma_dynamic) using closing prices to smooth out price fluctuations and identify trends.
Buy/Sell Signals:
Buy Signal: Triggered when the closing price crosses above the 120-day SMA (longSignal), indicating potential bullish momentum. A white triangle with "close" text appears below the bar.
Sell Signal: Triggered when the closing price crosses below the 120-day SMA (shortSignal), suggesting bearish momentum. A yellow triangle with "Short" text appears above the bar.
Alerts: Generates alerts for buy (Long Signal Alert) and sell (Short Signal Alert) signals, notifying users when the price crosses the SMA.
Visual Highlights:
Price vs. SMA: The area between the closing price and the 120-day SMA is filled with yellow if the price is above the SMA (bullish) or blue if below (bearish).
50-day vs. 120-day SMA: The area between the 50-day SMA and 120-day SMA is filled green when the 50-day SMA is above the 120-day SMA, indicating a stronger bullish trend.
Created by masterbtcltc, this indicator helps traders identify trend changes and potential entry/exit points based on price interactions with the 120-day SMA, with clear visual cues and alerts for decision-making.
Nota Keluaran
text changeNota Keluaran
added risk off and candle color changes so hide the main assetSkrip sumber terbuka
Dalam semangat TradingView sebenar, pencipta skrip ini telah menjadikannya sumber terbuka, jadi pedagang boleh menilai dan mengesahkan kefungsiannya. Terima kasih kepada penulis! Walaupuan anda boleh menggunakan secara percuma, ingat bahawa penerbitan semula kod ini tertakluk kepada Peraturan Dalaman.
Penafian
Maklumat dan penerbitan adalah tidak bertujuan, dan tidak membentuk, nasihat atau cadangan kewangan, pelaburan, dagangan atau jenis lain yang diberikan atau disahkan oleh TradingView. Baca lebih dalam Terma Penggunaan.
Skrip sumber terbuka
Dalam semangat TradingView sebenar, pencipta skrip ini telah menjadikannya sumber terbuka, jadi pedagang boleh menilai dan mengesahkan kefungsiannya. Terima kasih kepada penulis! Walaupuan anda boleh menggunakan secara percuma, ingat bahawa penerbitan semula kod ini tertakluk kepada Peraturan Dalaman.
Penafian
Maklumat dan penerbitan adalah tidak bertujuan, dan tidak membentuk, nasihat atau cadangan kewangan, pelaburan, dagangan atau jenis lain yang diberikan atau disahkan oleh TradingView. Baca lebih dalam Terma Penggunaan.