UDAY_C_Santhakumar

UCS_S_Steve Primo - Strategy 4 - Version 2

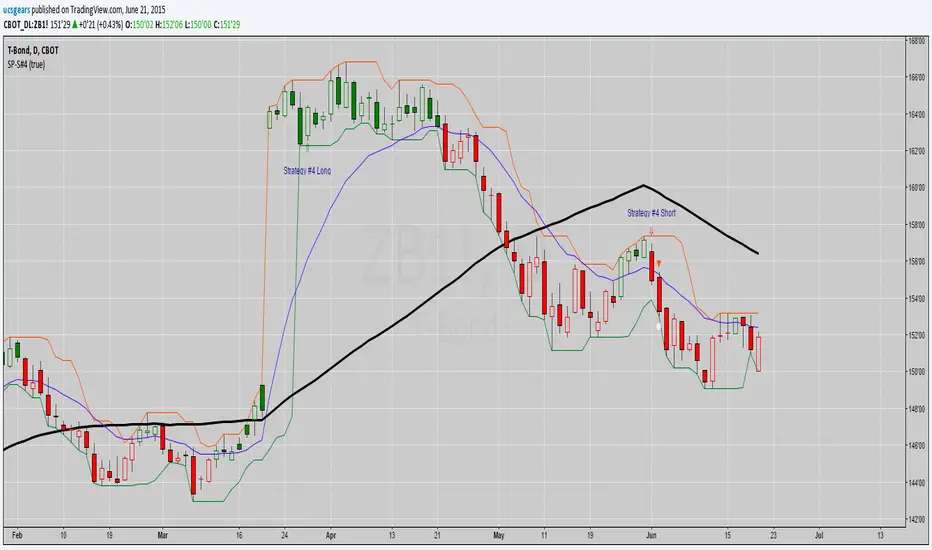
For those who are interested with this strategy, Here is a better version.

Uday C Santhakumar
Skrip sumber terbuka

Dalam semangat TradingView yang sebenar, penulis skrip ini telah menerbitkannya dengan menggunakan sumber terbuka supaya pedagang-pedagang dapat memahami dan mengesahkannya. Sorakan kepada penulis! Anda dapat menggunakannya secara percuma tetapi penggunaan semula kod ini dalam penerbitan adalah dikawalselia oleh Peraturan Dalaman. Anda boleh menyukainya untuk menggunakannya pada carta.

Penafian

Maklumat dan penerbitan adalah tidak dimaksudkan untuk menjadi, dan tidak membentuk, nasihat untuk kewangan, pelaburan, perdagangan dan jenis-jenis lain atau cadangan yang dibekalkan atau disahkan oleh TradingView. Baca dengan lebih lanjut di Terma Penggunaan.

Ingin menggunakan skrip ini pada carta?
// Created by UCSgears
// Includes options to confirm with Pet-d

study(shorttitle="SP-S#4", title = "Steve Primo - Strategy #4", overlay = true, precision = 2)

basisma = sma(close,50)
petd = ema(close,15)

usepetd = input(true, title = "PET-D Confirmation Required")

trendup = usepetd == 1 ? close > basisma and close > petd : close > basisma
trenddn = usepetd == 1 ? close < basisma and close < petd : close < basisma

// PET-D

petdcolor = close > petd ? green : red
barcolor (petdcolor)

// Pullback & Bounce Criteria
lowest = lowest(low,(5))
highest = highest(high,(5))
pullback = (low == lowest) or (low[1] == lowest[1]) ? 1 : 0
bounce = (high == highest) or (high[1] == highest[1]) ? 1 : 0

// ALL PLOT
plot (lowest, color = green, linewidth = 1, title = "Lower Band")
plot (highest, color = red, linewidth = 1, title = "Upper Band")
plot (basisma, color = black, linewidth = 3, title = "Trend - Long Term")
plot (petd, color = blue, linewidth = 1, title = "Trend - Short Term")

// 25% Close 
range = high - low
rbrng = abs(open-close)
// Long Setup
longcandle = close > low+range*.75 ? 1:0
// Short Setup
shortcandle = close < low+range*.25 ? 1:0

//Setups
setuplong = trendup == 1 and pullback == 1 and longcandle == 1 ? 1:0
setupshort = trenddn == 1 and bounce == 1 and shortcandle == 1 ? 1:0

//setuplong = setuplonggeneral == 1 and setuplonggeneral[1] == 0 ? 1:0
//setupshort = setupshortgeneral == 1 and setupshortgeneral[1] == 0 ? 1:0

bcl = rbrng > (rma(tr,5)*1.1) ? blue : green
bcs = rbrng > (rma(tr,5)*1.1) ? blue : red

plotchar(setuplong, title="Long Setup Bar", char='⇑', location=location.belowbar, color=bcl, transp=0, text="Strategy #4 Long")
plotchar(setupshort, title="Short Setup Bar", char='⇓', location=location.abovebar, color=bcs, transp=0, text="Strategy #4 Short")

//Trade Trigger
tiggerlongcandle = (setuplong[1] == 1) and (high > high[1]) ? 1 : 0
tiggershortcandle = (setupshort[1] == 1) and (low < low[1]) ? 1 : 0
plotshape(tiggerlongcandle ? tiggerlongcandle : na, title="Triggered Long",style=shape.triangleup, location=location.belowbar, color=green, transp=0, offset=0)
plotshape(tiggershortcandle ? tiggershortcandle : na, title="Triggered Short",style=shape.triangledown, location=location.abovebar, color=red, transp=0, offset=0)

// Trade Target Signal

tarup = (tiggerlongcandle==1 and setuplong[1] == 1) ? high[1]+range[1] : na
plotshape(tarup, style = shape.circle, location = location.absolute, title = "Target Long", color = white)

tardn = (tiggershortcandle==1 and setupshort[1] == 1) ? low[1]-range[1] : na
plotshape(tardn, style = shape.circle, location = location.absolute, title = "Target Short", color = white)