OPEN-SOURCE SCRIPT
Telah dikemas kini VWAP (Enhanced)

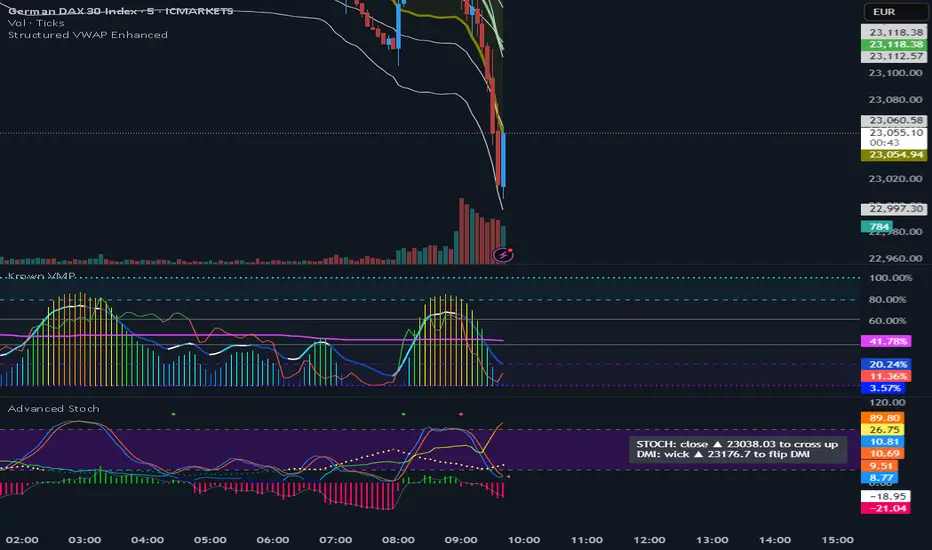
Structured VWAP Enhanced
A dynamic, multi-functional VWAP indicator designed to help traders visualize key support and resistance levels during the trading session. This indicator computes the Volume Weighted Average Price (VWAP) along with two structured bands derived from customizable multipliers based on either standard deviation or percentage. In addition, it offers the following features:
Dual Bands: Displays two bands (Band #1 and Band #2) that adapt to market volatility, each with its own customizable multiplier.
Dynamic Midlines: Plots both the original midlines (the center of each band) and enhanced midlines between the VWAP and each band edge for clearer visual cues.
Fixed Offset Bands: Includes offset lines set at a fixed 0.25% above and below the VWAP and each band level to help highlight near-term price targets.
Custom VWAP Anchoring: Supports various anchoring periods (Session, Week, Month, etc.) and special events (Earnings, Dividends, Splits) to reset VWAP calculations, making it adaptable to different trading styles.
Visual Customization: Easily toggle the display of each component (bands, midlines, enhanced midlines, and offset lines) to suit your analysis needs.
Whether you are an intraday trader or a longer-term market participant, Structured VWAP Enhanced provides a robust framework to identify price imbalances and potential turning points throughout your trading day.
Add this indicator to your chart for a comprehensive view of VWAP dynamics and structured market levels.
Nota Keluaran
Volume Weighted Average Price with Structured Bands (Enhanced)This custom indicator is a powerful tool designed to enhance your VWAP analysis by adding structured bands and visual cues around the VWAP level. The script computes the VWAP for a user-defined anchor period (e.g., Session, Week, Month, etc.) and then builds additional layers of information around it:
Structured Bands:
Two bands are plotted above and below the VWAP. The distance from the VWAP is calculated using either a multiplier of the standard deviation or a fixed percentage of the VWAP. These bands help identify potential support and resistance levels.
Midlines:
Each band has an original midline, calculated as the average of the band’s upper and lower levels. Additionally, enhanced midlines are drawn between the VWAP and the band edges. Both sets of midlines are displayed in gray, offering a clear visual reference for potential price reaction zones.
Fixed Offset Lines:
The indicator also plots offset lines at a fixed 0.25% above and below the VWAP, Band #1, and Band #2 levels. These additional lines serve as further reference points for short-term price fluctuations.
Customization Options:
Users can customize the VWAP anchor period, choose between standard deviation or percentage-based band calculations, adjust band multipliers, and toggle the visibility of bands and midlines—all directly from the indicator’s settings.
This indicator is ideal for intraday traders looking to identify dynamic support and resistance areas around the VWAP and refine their entry/exit decisions with additional visual context.
Skrip sumber terbuka
Dalam semangat TradingView sebenar, pencipta skrip ini telah menjadikannya sumber terbuka, jadi pedagang boleh menilai dan mengesahkan kefungsiannya. Terima kasih kepada penulis! Walaupuan anda boleh menggunakan secara percuma, ingat bahawa penerbitan semula kod ini tertakluk kepada Peraturan Dalaman.
Penafian
Maklumat dan penerbitan adalah tidak bertujuan, dan tidak membentuk, nasihat atau cadangan kewangan, pelaburan, dagangan atau jenis lain yang diberikan atau disahkan oleh TradingView. Baca lebih dalam Terma Penggunaan.