OPEN-SOURCE SCRIPT
Telah dikemas kini RAT Momentum Squeeze BETA
V1.0
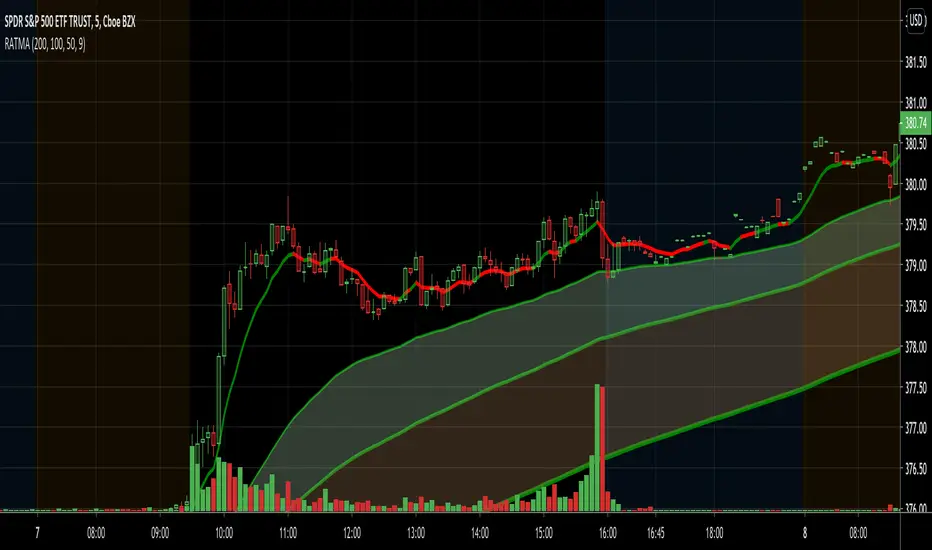
MAs are a great tool to measure the market's momentum. I created this indicator to graphically depict bullish and banishment movements with the moving averages.
Using the 50, 100, & 200 day MA in conjunction with the RSI we are able to find great swing setups. This is used best on the 30min & up to the daily chart.
Nota Keluaran
*Cleaned up codeNota Keluaran
V1.0 Release NotesAdded 9-day moving average with dynamic color based on 9-day RSI over/oversold levels
Added dynamic color changing to all moving averages based on the directional movement
Nota Keluaran
Added conditional formatting to the colors on the 9-day moving average. The greener the color, the more overbought. The darker the red, the more oversold. I will tweak the colors of the cloud and line itself in a future update.Nota Keluaran
Exciting new update :)-Added improved accuracy for the strength in the trend by calculating different RSI lengths
-Added bar overlays to help show the strength of the trend
-Improved colors on the 9 day MA overlay

Nota Keluaran
Switched MAs to EMAs. After doing extensive backtesting I think EMAs are much more accurate for the purpose of this indicator Nota Keluaran
Changed SMAs to EMAs for improved accuracy Nota Keluaran
changed RSI sensitivity Skrip sumber terbuka
Dalam semangat TradingView sebenar, pencipta skrip ini telah menjadikannya sumber terbuka, jadi pedagang boleh menilai dan mengesahkan kefungsiannya. Terima kasih kepada penulis! Walaupuan anda boleh menggunakan secara percuma, ingat bahawa penerbitan semula kod ini tertakluk kepada Peraturan Dalaman.
Penafian
Maklumat dan penerbitan adalah tidak bertujuan, dan tidak membentuk, nasihat atau cadangan kewangan, pelaburan, dagangan atau jenis lain yang diberikan atau disahkan oleh TradingView. Baca lebih dalam Terma Penggunaan.
Skrip sumber terbuka
Dalam semangat TradingView sebenar, pencipta skrip ini telah menjadikannya sumber terbuka, jadi pedagang boleh menilai dan mengesahkan kefungsiannya. Terima kasih kepada penulis! Walaupuan anda boleh menggunakan secara percuma, ingat bahawa penerbitan semula kod ini tertakluk kepada Peraturan Dalaman.
Penafian
Maklumat dan penerbitan adalah tidak bertujuan, dan tidak membentuk, nasihat atau cadangan kewangan, pelaburan, dagangan atau jenis lain yang diberikan atau disahkan oleh TradingView. Baca lebih dalam Terma Penggunaan.