OPEN-SOURCE SCRIPT
M2 Liquidity Divergence Model

M2 Liquidity Divergence Model
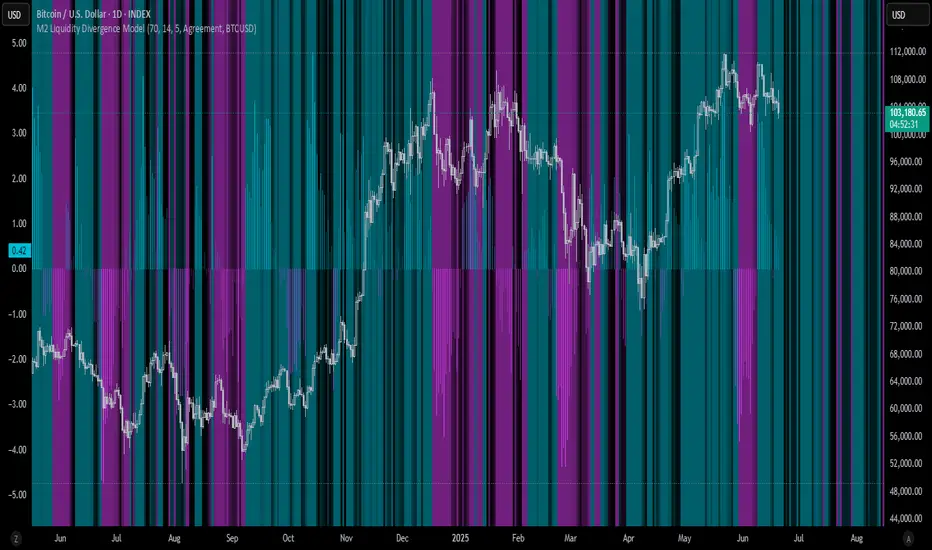
The M2 Liquidity Divergence Model is a macro-aware visualization tool designed to compare shifts in global liquidity (M2) against the performance of a benchmark asset (default: Bitcoin). This script captures liquidity flows across major global economies and highlights whether price action is aligned ("Agreement") or diverging ("Divergence") from macro trends.
🔍 Core Features
M2 Global Liquidity Index (GLI):
Aggregates M2 money supply from major global economies, FX-adjusted, including extended contributors like India, Brazil, and South Africa. The slope of this composite is used to infer macro liquidity trends.
Lag Offset Control:
Allows the M2 signal to lead benchmark asset price by a configurable number of days (Lag Offset), useful for modeling the forward-looking nature of macro flows.
Gradient Macro Context (Background):
Displays a color-gradient background—aqua for expansionary liquidity, fuchsia for contraction—based on the slope and volatility of M2. This contextual backdrop helps users visually anchor price action within macro shifts.
Divergence Histogram (Optional):
Plots a histogram showing dynamic correlation or divergence between the liquidity index and the selected benchmark.
Agreement Mode: M2 and asset are moving together.
Divergence Mode: Highlights break in expected macro-asset alignment.
Adaptive Transparency Scaling:
Histogram and background gradients scale their visual intensity based on statistical deviation to emphasize stronger signals.
Toggle Options:
Show/hide the M2 Liquidity Index line.
Show/hide divergence histogram.
Enable/disable visual offset of M2 to benchmark.
🧠 Suggested Usage
Macro Positioning: Use the background context to align directional trades with macro liquidity flows.
Disagreement as Signal: Use divergence plots to identify when price moves against macro expectations—potential reversal or exhaustion zones.
Time-Based Alignment: Adjust Lag Offset to synchronize M2 signals with asset price behavior across different market conditions.
⚠️ Disclaimer
This indicator is designed for educational and analytical purposes only. It does not constitute financial advice or an investment recommendation. Always conduct your own research and consult a licensed financial advisor before making trading decisions.
Skrip sumber terbuka
Dalam semangat TradingView sebenar, pencipta skrip ini telah menjadikannya sumber terbuka, jadi pedagang boleh menilai dan mengesahkan kefungsiannya. Terima kasih kepada penulis! Walaupuan anda boleh menggunakan secara percuma, ingat bahawa penerbitan semula kod ini tertakluk kepada Peraturan Dalaman.
Penafian
Maklumat dan penerbitan adalah tidak bertujuan, dan tidak membentuk, nasihat atau cadangan kewangan, pelaburan, dagangan atau jenis lain yang diberikan atau disahkan oleh TradingView. Baca lebih dalam Terma Penggunaan.