EDGAR Weekly Overview (EWO)
The EDGAR Weekly Overview (EWO) gives traders a clear map of market direction throughout the week.
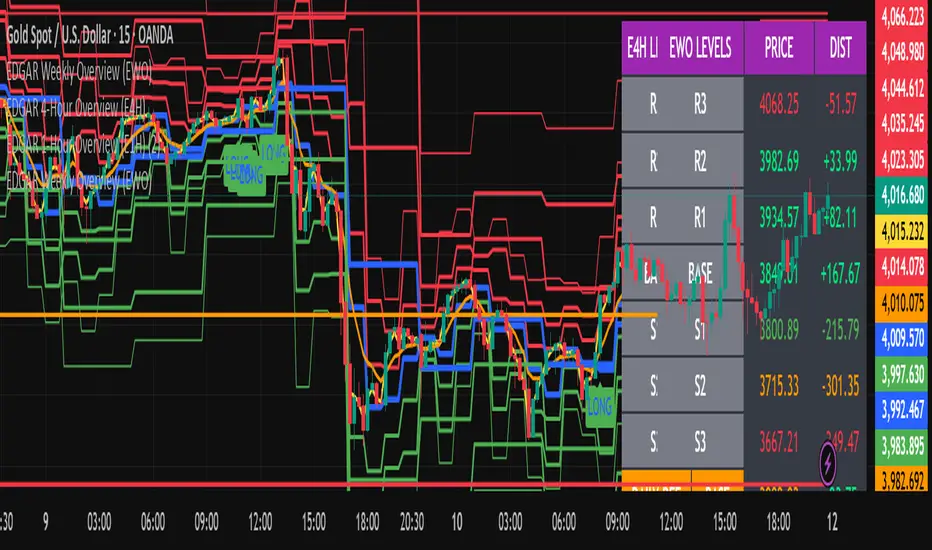
It detects how price reacts to institutional zones and shows where the market could move next — whether it’s pushing upward toward R3 or falling toward S3.
From Monday’s opening, you can instantly see if the market starts building bullish momentum or showing weakness.
It helps you visualize how the weekly trend develops, so you can plan sniper entries on lower timeframes like M1 or M5 with higher accuracy.
⚙️ Key Features:
Tracks weekly high, low, and close for precise base levels
Displays resistance/support zones (R3–R1, BASE, S1–S3)
Real-time distance display for each level on dashboard
Works perfectly with gold (XAUUSD), indices, and crypto
Great for top-down analysis with 1-hour or 1-minute scalping
📈 How It Helps You:
Within a single week, you can clearly see:
Where the market is heading (up or down)
Which levels the price is likely to reject or break
How big players and institutions are positioning
This makes it easier to follow weekly structure and avoid entering against the main market flow.
Skrip jemputan sahaja
Hanya pengguna yang diluluskan oleh penulis boleh mengakses skrip ini. Anda perlu memohon dan mendapatkan kebenaran untuk menggunakannya. Ini selalunya diberikan selepas pembayaran. Untuk lebih butiran, ikuti arahan penulis di bawah atau hubungi terus goldbtcwhales.
TradingView tidak menyarankan pembayaran untuk atau menggunakan skrip kecuali anda benar-benar mempercayai penulisnya dan memahami bagaimana ia berfungsi. Anda juga boleh mendapatkan alternatif sumber terbuka lain yang percuma dalam skrip komuniti kami.
Arahan penulis
Penafian
Skrip jemputan sahaja
Hanya pengguna yang diluluskan oleh penulis boleh mengakses skrip ini. Anda perlu memohon dan mendapatkan kebenaran untuk menggunakannya. Ini selalunya diberikan selepas pembayaran. Untuk lebih butiran, ikuti arahan penulis di bawah atau hubungi terus goldbtcwhales.
TradingView tidak menyarankan pembayaran untuk atau menggunakan skrip kecuali anda benar-benar mempercayai penulisnya dan memahami bagaimana ia berfungsi. Anda juga boleh mendapatkan alternatif sumber terbuka lain yang percuma dalam skrip komuniti kami.