PROTECTED SOURCE SCRIPT
Telah dikemas kini ICT ADR Levels - Judas x Daily Range Meter°
The Average Daily Range (ADR) is a common metric used to measure volatility in an asset. It calculates the average difference between the highest and lowest price over a time interval – normally five days.
The Inner Circle Trader teaches the importance of this metric from an algorithmic point of view; in particular the 1/3ADR price level is deemed to be a threshold used to determine the area at which a Judas Swing – false move to trick market participants, protraction, manipulation – might exhaust. Another key difference in the ICT-use of this metric compared to the classic approach is that the average range is calculated from New York midnight Time, rather than the daily candle's open.
It is crucial to remember that the elements of Time are key when it comes to interpreting how price action will, or won't, react to this level: what Time of the day is it? what day of the week? what week of the month?
Let's consider the Time of the day. If one thinks about the Power of Three of the daily candle (Accumulation, Manipulation Distribution), it is highly unlikely that a Manipulation event will happen later in the day – whereas seeing the 1/3ADR hold in London session or New York open gives undeniable edge to an Analyst.
Apart from the 1/3ADR level seen from a Judas perspective, the opposing 1/3 level, and the full ADR projections, are excellent algorithmic levels at which we will see orderflow or reactions worth studying. These can be take profit targets, reversal opportunities, pyramid entries, ... Study them, and find what works for you!
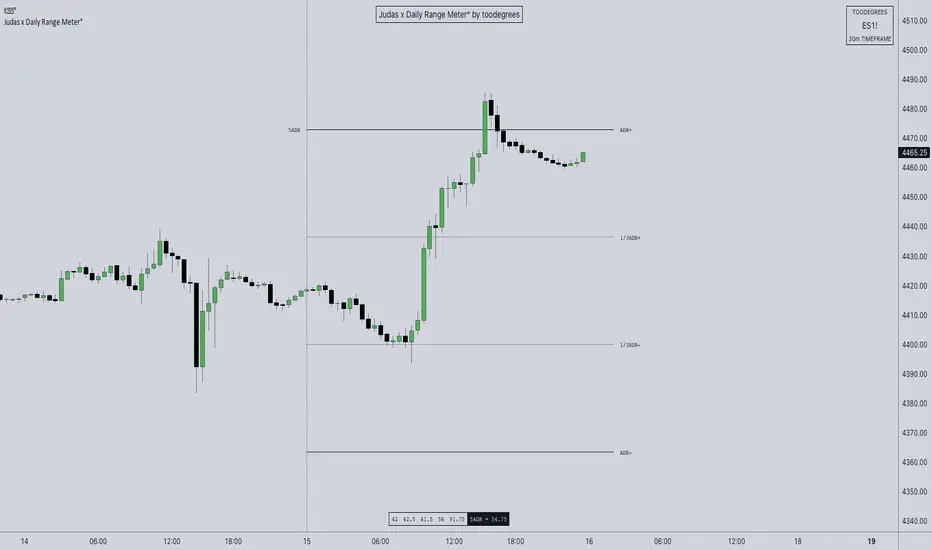
Examples:
– YM1! at Equity Open

– BTCUSD Perfect Buy Day Signature

–
 EURUSD Clean Break = No Judas

– GC Repeated Attempts = Liquidity Engineering

The Inner Circle Trader teaches the importance of this metric from an algorithmic point of view; in particular the 1/3ADR price level is deemed to be a threshold used to determine the area at which a Judas Swing – false move to trick market participants, protraction, manipulation – might exhaust. Another key difference in the ICT-use of this metric compared to the classic approach is that the average range is calculated from New York midnight Time, rather than the daily candle's open.
It is crucial to remember that the elements of Time are key when it comes to interpreting how price action will, or won't, react to this level: what Time of the day is it? what day of the week? what week of the month?
Let's consider the Time of the day. If one thinks about the Power of Three of the daily candle (Accumulation, Manipulation Distribution), it is highly unlikely that a Manipulation event will happen later in the day – whereas seeing the 1/3ADR hold in London session or New York open gives undeniable edge to an Analyst.
Apart from the 1/3ADR level seen from a Judas perspective, the opposing 1/3 level, and the full ADR projections, are excellent algorithmic levels at which we will see orderflow or reactions worth studying. These can be take profit targets, reversal opportunities, pyramid entries, ... Study them, and find what works for you!
- Features:
- Display a table with the previous N days' ranges and the current ADR value
- Decide whether to consider daily candles, or New York (00:00 to 00:00 NY Time) for the basis of the calculation
- See the ADR Range, the ADR price levels and 1/3ADR price levels by hovering over the text labels
- Plot the ADR levels from the Midnight Anchor, or as offset markers on the side for a cleaner look
- Show/Hide all elements individually
Examples:
–
–
–
–
Nota Keluaran
Bug Fix: offset was not working properly, fixedNota Keluaran
Bug Fix: wasn't working on stocks, fixedNota Keluaran
Bug Fix: labels and lines overlap, fixedNota Keluaran
Minor Update:- Added Last 10 Historical Session's ADR Levels
- Added Auto Color / Custom Color Choice
- Added Size and Location Choice for Previous Ranges Table
- Added Text Size Choice
– Historical Sessions:
Nota Keluaran
Bug Fix: NIFTY traders couldn't see ADR Levels due to open Time, fixed.Nota Keluaran
Minor Bug FixNota Keluaran
Update shortened trading session stackNota Keluaran
Minor Bug FixesNota Keluaran
Code optimization, fasterNota Keluaran
Cleaned up code, fixed minor bugs.Nota Keluaran
Optimization: better data fetching -> faster and more accurateNota Keluaran
Minor Bug FixNota Keluaran
Minor Bug FixSkrip dilindungi
Skrip ini diterbitkan sebagai sumber tertutup. Akan tetapi, anda boleh menggunakannya dengan percuma dan tanpa had – ketahui lebih lanjut di sini.
homo faber fortunæ suæ
Penafian
Maklumat dan penerbitan adalah tidak dimaksudkan untuk menjadi, dan tidak membentuk, nasihat untuk kewangan, pelaburan, perdagangan dan jenis-jenis lain atau cadangan yang dibekalkan atau disahkan oleh TradingView. Baca dengan lebih lanjut di Terma Penggunaan.
Skrip dilindungi
Skrip ini diterbitkan sebagai sumber tertutup. Akan tetapi, anda boleh menggunakannya dengan percuma dan tanpa had – ketahui lebih lanjut di sini.
homo faber fortunæ suæ
Penafian
Maklumat dan penerbitan adalah tidak dimaksudkan untuk menjadi, dan tidak membentuk, nasihat untuk kewangan, pelaburan, perdagangan dan jenis-jenis lain atau cadangan yang dibekalkan atau disahkan oleh TradingView. Baca dengan lebih lanjut di Terma Penggunaan.